
MSAZ-312 · Lesson 1 of 12 · 23 min
Performance tuning semantic models
▶ Video coming soon A video version of this lesson is on the way.
By the end of the MSAZ-311 model sessions, Keiko Tanabe had built the Sales Overview semantic model for the Finch Data Hub at Harrow & Finch Home Supply in Des Moines, and Grace Oduya had her answer about paint margin. A second problem had been waiting the whole time. Finance ran its own Power BI model, Finance Margin, built three years earlier by the finance analyst Rosa Ilunga in Power BI Desktop. It imported every sales line from StockLine through the on-premises data gateway, took two hours and forty minutes to refresh each night, and made the monthly margin pack crawl. Dana Whitcombe, the chief financial officer, asked Marisol Vega to fix it before the hub's pilot on an F16 capacity starts on January 4, 2027.
Marisol ran the work as a series of lunchtime "tune sessions", separate from the afternoon model sessions, from Tuesday, October 27 to Friday, November 13, 2026. Keiko came to all twelve, Rosa came to most, and Nikolai Petrenko joined when a change touched the engineering side. Everything happened on the hub's trial capacity, which gives 64 capacity units, four times the F16 planned for the pilot, so Marisol kept reminding the group that a page that feels quick on the trial may not feel quick on the smaller capacity. This course follows those sessions. It covers the part of the DP-600 outline about optimizing enterprise-scale semantic models and managing them through their lifecycle, and it builds on the modeling skills from MSAZ-311.
One caution about the outline itself. In November 2026 Microsoft's DP-600 certification page listed three skill areas, while the separate study guide page still showed an older outline with four sections and different weights. Before booking the exam, check both pages and the study guide's change log, and treat the certification page as the more current of the two until they agree.
Marisol's first rule for tuning was the same as her rule for modeling, adjusted slightly: "Measure before you change anything." Most slow models have one or two causes that account for most of the delay, and guessing usually fixes the wrong one. The first session was about learning where time and memory go inside a semantic model, so that later sessions could aim at the real causes.
Where a query spends its time
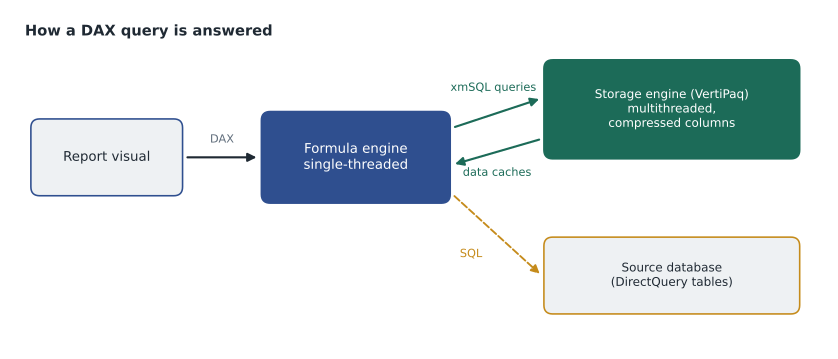
A report visual sends a DAX query to the semantic model. Inside the Analysis Services engine that runs Power BI and Fabric semantic models, two parts share the work. The formula engine reads the DAX, works out a plan and does the logic that the storage layer cannot do, such as complex branching and some iterations. It is single-threaded for each query. The storage engine scans the compressed columns and returns small result sets, called data caches, to the formula engine. For import and Direct Lake tables the storage engine is VertiPaq, the in-memory columnar engine; for DirectQuery tables it is the source database, which receives SQL.
VertiPaq is fast because it is multithreaded, works on compressed data and can scan hundreds of millions of rows in a fraction of a second. The formula engine is slower per row and runs on a single thread. A well-tuned measure therefore pushes as much work as possible into a few storage engine queries and leaves little for the formula engine. When a measure forces the formula engine to evaluate row by row, or makes the storage engine call back into the formula engine for each row, the query slows dramatically even though the data has not changed.
The first thing Marisol checked was therefore not the DAX but the size of the model, because memory drives everything else. A model that is larger than it needs to be takes longer to refresh, longer to load into memory when it has been evicted, and longer to scan; it also takes a larger share of the capacity's memory.
How VertiPaq stores a column
VertiPaq stores each column separately. It first encodes the values. For many columns it builds a dictionary, a list of the distinct values, and replaces each value in the column with a small integer that points into the dictionary; this is hash or dictionary encoding. For numeric columns whose values fall in a narrow range it can use value encoding, storing the number itself after a simple adjustment. It then compresses the encoded column, mainly by run-length encoding, which stores long runs of the same value once with a count. Rows are processed in segments; in the large semantic model storage format the default segment size is 8 million rows.
Two things follow from this. The first is that cardinality, the number of distinct values in a column, matters more than the number of rows. A status column with four values compresses to almost nothing even in a table of a hundred million rows, because the dictionary is tiny and the runs are long. A unique transaction identifier or a timestamp with seconds compresses badly, because every value is different and there are no runs. The second is that sort order matters, because runs are longer when similar values are next to each other. VertiPaq chooses its own sort order within a segment, but the order in which rows arrive still affects how well it can do.
| Column type | Typical cardinality | How it compresses |
|---|---|---|
| Flag or status (Yes/No, open/closed) | Two to a few dozen | Very well; long runs and a tiny dictionary |
| Foreign key to a dimension | Hundreds to tens of thousands | Well, especially if rows arrive in key order |
| Date key (one value per day) | About 365 per year | Very well |
| Date and time to the second | Up to one value per row | Poorly; often the largest column in the model |
| Unique row or transaction identifier | One value per row | Poorly; rarely needed for analysis |
| Amount with many decimals | High | Moderately; fixed decimal (currency) type and rounding help |
Reading a VertiPaq Analyzer report
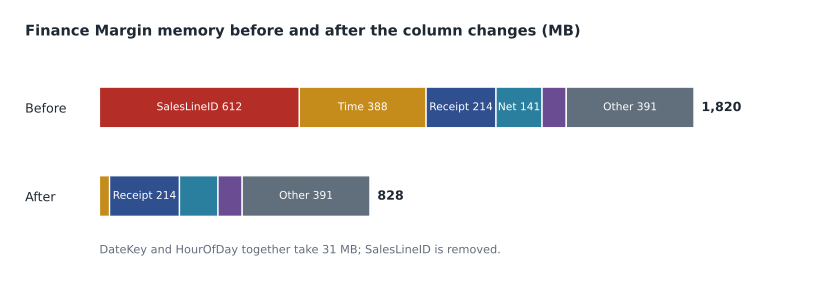
VertiPaq Analyzer is a set of tools and metrics, available in DAX Studio, Bravo and the semantic link labs library in Fabric notebooks, that reads a model's storage statistics and lists each table and column with its cardinality and size. Keiko opened Finance Margin in DAX Studio, which connects to a model through the XMLA endpoint or to Power BI Desktop, and ran View Metrics. The result showed that the model used about 1,820 MB of memory, and that one table, fact_sales, accounted for almost all of it.
| Column in fact_sales | Cardinality | Size (MB) | Used by reports? |
|---|---|---|---|
| SalesLineID | 41,200,000 | 612 | No |
| TransactionTime (date and time to the second) | 24,800,000 | 388 | Only for the hour of day |
| ReceiptNumber | 15,600,000 | 214 | Yes, for basket counts |
| NetAmount (decimal) | 1,940,000 | 141 | Yes |
| UnitCost (decimal) | 610,000 | 74 | Yes |
| All other columns in the model | Various | 391 | Mostly |
Three columns, none of which the reports needed in their current form, took about two thirds of the memory. SalesLineID was a unique identifier carried over from the source; no visual or measure used it. TransactionTime held the exact second of each sale, but the margin pack only grouped by hour of day. ReceiptNumber was used for a distinct count of baskets, so it had to stay, but at least it did not need to be joined to anything.
# Finance Margin column sizes from VertiPaq Analyzer (MB)
before = {"SalesLineID": 612, "TransactionTime": 388, "ReceiptNumber": 214,
          "NetAmount": 141, "UnitCost": 74, "Other columns": 391}
total_before = sum(before.values())

# Planned changes: drop SalesLineID, replace TransactionTime with
# DateKey + HourOfDay (31 MB together), fixed decimal for NetAmount (118 MB)
after = dict(before)
del after["SalesLineID"]
del after["TransactionTime"]
after["DateKey + HourOfDay"] = 31
after["NetAmount"] = 118
total_after = sum(after.values())

saved = total_before - total_after
print("Before:", total_before, "MB")
print("After: ", total_after, "MB")
print("Saved: ", saved, "MB, or", round(saved / total_before * 100, 1), "in 100")Before: 1820 MB After: 828 MB Saved: 992 MB, or 54.5 in 100
What this code does
The block adds up the memory used by each column in the Finance Margin model before any change, then builds a second list with the planned changes applied: one column removed, one replaced by two small columns and one stored in a more compact number type. It prints both totals and how much memory the changes would save, both in megabytes and as a share of the original size, so the team can see whether the plan is worth doing before touching the model.
The estimate said the model would shrink by more than half. Rosa checked with Dana that nobody used SalesLineID, and found that it had been added years earlier to debug a refresh and never removed. Marisol's rule for columns was blunt: if no visual, measure, relationship or role uses a column, it does not belong in an import model. A column can always be added back; memory spent on an unused column is spent every night.
Worked problem
Splitting a timestamp
TransactionTime has about 24.8 million distinct values. The reports need only the date and the hour of day. How many distinct values would a DateKey column and an HourOfDay column hold for three years of data, and why is that so much smaller?
Show solution
- Three years of daily keys is about 3 × 365 = 1,095 values, plus one for a leap year, so about 1,096 distinct DateKey values.
- An HourOfDay column has 24 possible values, 0 to 23, and the stores trade in only some of them.
- Together that is about 1,096 + 24 = 1,120 dictionary entries instead of 24.8 million.
- Both columns also produce long runs of identical values, because many sales share a date and an hour, so run-length encoding works well.
Answer: About 1,120 distinct values across the two columns instead of about 24.8 million in one. That is why the estimate gives 31 MB for both together against 388 MB for the timestamp.
Other things that make a model large
Unused and high-cardinality columns are the most common causes of a large model, but not the only ones. Calculated columns are computed during refresh and stored like any other column, so a calculated column with many distinct values costs as much memory as an imported one, and it is computed after compression decisions have been made, which can make it compress worse. Where possible, Marisol preferred columns computed upstream in the warehouse or in Power Query.
Auto date/time, a Power BI Desktop option, creates a hidden date table for every date column in the model. In a model with many date columns these hidden tables add up and duplicate what a proper date dimension already does. Finance Margin had eleven date columns and eleven hidden date tables; Rosa turned the option off for the file and relied on dim_date, which MSAZ-311 had already built with a fiscal calendar.
Text columns with long values, such as product descriptions or free-text notes, can be large even with moderate cardinality, because the dictionary stores each distinct string. If reports show the description only in a detail table, it may belong on the dimension rather than the fact, or in a drill-through to a smaller table. Finally, unnecessary precision in numbers adds distinct values: storing a unit cost with six decimal places when the business uses two creates many values that look different to VertiPaq but mean the same thing.
A tuning method
Marisol wrote a method on the whiteboard that the group used for every model in the following sessions. First, define the target in terms a user would recognize: the margin pack's store page should open in under three seconds on the F16, and the nightly refresh should finish before 6:00 a.m. with room to spare. Second, measure the current state with the right tool: VertiPaq Analyzer for size, Performance Analyzer for report pages, DAX Studio server timings for individual queries, and the refresh history and capacity metrics app for refreshes.
Third, find the biggest single cause and fix that, then measure again; fixing several things at once makes it impossible to tell which change helped. Fourth, keep a short log of each change, the measurement before and after, and who agreed to it, because the same model will be tuned again next year by someone else. Fifth, stop when the target is met. A model can always be made slightly faster, and the time is often better spent on the next model.
| Symptom | First tool | Likely causes to check |
|---|---|---|
| Model is large or slow to load after eviction | VertiPaq Analyzer | Unused or high-cardinality columns, calculated columns, auto date/time |
| One visual is slow | Performance Analyzer, then DAX Studio | The measure behind it, a complex filter, a large table visual |
| Every page is slow at certain times | Capacity metrics app | Capacity overload or throttling, a refresh running at the same time |
| Refresh takes too long or fails | Refresh history, then the data source | Full reloads, query folding broken, too many columns, gateway limits |
Results of the first change
Rosa made the column changes in a copy of the Finance Margin file during the session: she removed SalesLineID, replaced TransactionTime with DateKey and HourOfDay in Power Query, changed NetAmount to fixed decimal, and turned off auto date/time. After a full refresh in Desktop, VertiPaq Analyzer showed 831 MB, three more than the estimate because of a rounding difference in the other columns. The store page of the margin pack went from 11.4 seconds to 6.2 seconds on the trial capacity with no other change, which told Marisol that size had been part of the problem but not all of it. The next session would look at the DAX.
The refresh was still a full reload of three years of sales every night, because the model had never been set up for incremental refresh. That became the subject of lesson 4. Marisol also noted that Finance Margin and Sales Overview now held the same sales lines twice, once imported and once in Direct Lake, and that the longer-term question was whether finance needed its own copy at all; that question returned in lessons 9 and 12.
Common mistakes
MistakeStart tuning by rewriting the slowest-looking measure.
InsteadMeasure first; size and model design often explain more of the delay than DAX.
MistakeRow count is what makes a model large.
InsteadCardinality and data type matter more; a column with few distinct values is cheap at any row count.
MistakeCalculated columns are free because they are computed in the model.
InsteadThey are stored like any column and often compress worse; compute them upstream where possible.
MistakeKeep every source column in case someone needs it later.
InsteadUnused columns cost memory and refresh time every day; add them back when there is a real need.
Summary and key terms
- A DAX query is planned by the single-threaded formula engine and answered by storage engine queries; for import and Direct Lake tables that is VertiPaq.
- VertiPaq stores columns separately with dictionary or value encoding and run-length compression, so cardinality drives size.
- VertiPaq Analyzer lists each column's cardinality and size; unused, unique and timestamp columns are the usual culprits.
- Splitting a date and time into a date key and an hour, removing unused columns and using fixed decimal types shrink models sharply.
- Auto date/time and high-cardinality calculated columns add hidden size; turn the option off and compute columns upstream.
- Tune by setting a user-level target, measuring, fixing the biggest cause, measuring again and logging each change.
- Formula engine
- The single-threaded part of the engine that plans DAX queries and performs logic the storage engine cannot.
- Storage engine
- The part that scans data and returns data caches; VertiPaq for import and Direct Lake, the source for DirectQuery.
- VertiPaq
- The in-memory columnar engine that stores and scans compressed columns in semantic models.
- Cardinality
- The number of distinct values in a column.
- Dictionary encoding
- Replacing each value with an integer that points into a list of distinct values.
- Run-length encoding
- Storing a run of identical values once, with a count.
- VertiPaq Analyzer
- Tools and metrics that report the size and cardinality of each table and column in a model.
Practice problems
Work each problem on paper first, then reveal the answer to check.
Why is a column with four distinct values cheap even in a huge table?
Show answer
Its dictionary is tiny and the values form long runs, so run-length encoding stores very little.
Which Finance Margin column was removed first, and why?
Show answer
SalesLineID, a unique identifier that no visual, measure, relationship or role used.
How did the team keep the hour of day while dropping TransactionTime?
Show answer
They replaced it with a DateKey column and an HourOfDay column, which have about 1,120 distinct values together.
Which tool did Keiko use to see column sizes?
Show answer
DAX Studio's View Metrics, which shows VertiPaq Analyzer statistics.
Why measure again after each single change?
Show answer
So the effect of each change is known, and changes that do not help can be undone.
Lesson quiz · 5 questions
Score 60% or more to complete this lesson.
Create a free account to save your progress, take quizzes and earn a certificate.