
MSAZ-311 · Lesson 8 of 12 · 20 min
Relationships and model properties
▶ Video coming soon A video version of this lesson is on the way.
On Monday, November 9, Keiko arrived at the eighth model session with a puzzle. A test report showed Finch Rewards points by household, and the total at the bottom was smaller than the sum of the households above it. Marisol smiled, because it was the best possible introduction to relationships. "The model is doing exactly what you told it," she said. "Today we find out what you told it."
Relationships and filter propagation
A relationship in a semantic model connects a column in one table to a column in another, usually a dimension's key to the matching key in a fact table. Its purpose is to let filters travel. When a report filters dim_store to the Prairie region, the relationship carries that filter to fact_sales, so a measure that sums sales sees only Prairie rows. Relationships are not joins that run once; they are paths that the engine follows every time a measure is evaluated, in whatever filter context the visual provides.
Each relationship has three properties that matter. Cardinality says how many rows on each side can match: one-to-many, one-to-one or many-to-many. Cross-filter direction says which way filters travel: single, from the one side to the many side, or both. And the relationship is either active, used automatically, or inactive, used only when a measure asks for it. Power BI detects cardinality from the data when a relationship is created, but the modeler should always check it.
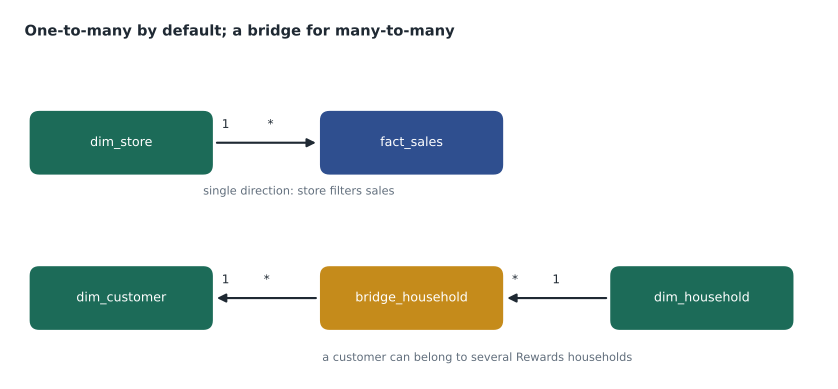
One-to-many, single direction: the default to aim for
In a well-designed star, nearly every relationship is one-to-many from a dimension to a fact, with single cross-filter direction. That gives predictable results and the best performance: dimensions filter facts, and facts never filter dimensions. Keiko's Sales Overview had six such relationships from the dimensions to fact_sales and two from dim_store and dim_date to fact_sales_target, which is what made it possible to show sales and targets side by side, filtered by the same store and month.
Bidirectional filtering, where filters also travel from the many side back to the one side, is sometimes needed but has costs. It can make filter paths ambiguous when there is more than one route between two tables, which Power BI prevents by refusing to create a relationship that would cause ambiguity; it can slow queries; and it can produce surprising results in slicers, such as a product slicer that only shows products that sold in the selected store. Marisol's rule: single direction unless a specific requirement needs both, and then prefer turning on both directions inside one measure with the CROSSFILTER function rather than on the relationship for everyone.
Checking keys before relating tables
A one-to-many relationship needs a column with unique values on the one side. If the dimension key has a duplicate, Power BI cannot create a one-to-many relationship and offers many-to-many instead, which is almost always a sign of a data problem, not a modeling choice. The many side should have no keys that are missing from the one side; if it does, those facts are grouped under a blank member in visuals. Keiko checked both conditions before building any relationship.
# Check a dimension key and a fact key before creating a relationship
dim_product_keys = [-1, 1, 2, 3, 4, 5, 5]          # key 5 appears twice
fact_product_keys = [1, 1, 2, 3, 3, 3, 4, 6, 6, -1]  # key 6 is not in the dimension

dupes = sorted({k for k in dim_product_keys if dim_product_keys.count(k) > 1})
missing = sorted(set(fact_product_keys) - set(dim_product_keys))
orphan_rows = sum(1 for k in fact_product_keys if k in missing)

print("Duplicate keys on the one side:", dupes)
print("Fact keys missing from the dimension:", missing)
print("Fact rows that would appear under a blank member:", orphan_rows)Duplicate keys on the one side: [5] Fact keys missing from the dimension: [6] Fact rows that would appear under a blank member: 2
What this code does
The example uses two small lists of product keys, one from the dimension and one from the fact table. It looks for keys that appear more than once in the dimension, which would stop a one-to-many relationship, and for keys in the fact that the dimension does not have. The output shows key 5 duplicated in the dimension and key 6 missing from it, affecting two fact rows that a report would show under a blank product.
In the real data, the duplicate came from a SKU that StockLine had reused for a different product in 2023, which the Type 2 logic should have given a new surrogate key; the orphans were sales of SKUs created after the dimension's last load. Both were fixed in the warehouse, which Marisol insisted is where such problems belong: a model that hides bad keys with many-to-many relationships just moves the problem into every report.
Many-to-many: real and accidental
Some relationships really are many-to-many. Finch Rewards households were the example: since 2025 a member can belong to more than one household, so the bridge table from lesson 5, bridge_household_member, has one row per member and household. In the model, dim_customer relates one-to-many to the bridge, dim_household relates one-to-many to the bridge, and the relationship between the bridge and dim_customer must filter in both directions so that a filter on a household reaches its members and then their sales.
That design explained Keiko's puzzle. A member who belongs to two households is counted once in each household's row, because both households' filters reach her points. At the total row, there is no household filter, so each member's points are counted once. The total is therefore smaller than the sum of the rows, and correctly so: it is the total points earned, not the sum of the households' totals. Marisol said the report needed a sentence under the table explaining that members can belong to several households, not a change to the numbers.
Worked problem
Why the total is smaller
Three members earn points in October: Ana 1,200, Ben 800 and Chen 500. Ana belongs to the Silva and Moreau households, Ben to Silva only and Chen to Moreau only. What does the household table show for each household and at the total?
Show solution
- The Silva household filter reaches Ana and Ben: 1,200 + 800 = 2,000 points.
- The Moreau household filter reaches Ana and Chen: 1,200 + 500 = 1,700 points.
- The rows add up to 2,000 + 1,700 = 3,700, because Ana is counted in both households.
- The total row has no household filter, so it counts each member once: 1,200 + 800 + 500 = 2,500 points.
Answer: Silva 2,000, Moreau 1,700, total 2,500. The total is correct; the rows overlap because Ana belongs to both households.
Power BI also allows a direct many-to-many relationship between two tables without a bridge, for example between a monthly target table at category grain and a product dimension, where category values repeat on both sides. These are legitimate in composite and aggregated designs, but they hide the overlap logic and can be slower, so Marisol preferred explicit bridge tables in the warehouse whenever the business rule was a real one.
Active and inactive relationships
Only one active path may exist between two tables. When a fact has two dates, such as the sale date and the promised delivery date of special orders, both can relate to dim_date, but only one relationship can be active; the other is inactive and drawn as a dashed line. A measure activates it for its own calculation with USERELATIONSHIP, as lesson 9 shows. The alternative is to load the date dimension twice as two tables, Sale Date and Delivery Date, which makes reports easier to build but makes the model larger. Keiko kept one date table and one inactive relationship, because only two measures needed the delivery date.
Model properties that make reports easier
Relationships are only part of a usable model. Marisol walked Keiko through a checklist of properties, all set in the model view or the TMDL view, that make the difference between a model that report authors understand and one they fight with.
| Property | What Keiko set | Why it matters |
|---|---|---|
| Hidden columns | Every key column and every fact column used only by measures | Authors see only fields that make sense to drag |
| Sort by column | Month name sorted by month number; fiscal week by its number | Months appear January to December, not alphabetically |
| Data category | City, Province or State, Postal code on dim_store | Maps place stores correctly |
| Summarize by | None for StoreId, years and other numeric attributes | Stops accidental sums of numbers that are labels |
| Format strings | Currency for amounts, whole numbers for units, one decimal for margin ratios | Every report shows numbers the same way |
| Hierarchies | Region, then store; fiscal year, quarter, week, date | Drill-down works without building it in each report |
| Display folders | Measures grouped into Sales, Margin, Targets, Rewards | Long field lists become navigable |
| Mark as date table | dim_date marked, with Date as its date column | Time intelligence functions work reliably |
Two properties deserve a note. Marking dim_date as the date table tells the engine which table and column to use for time intelligence, and turns off the automatic hidden date tables that Power BI Desktop otherwise creates for every date column, which bloat a model. And setting summarize-by to none on numeric attributes, such as the store number, prevents the classic report where someone drags StoreId onto a table and sees 276, the sum of the store numbers, instead of a list of stores.
Large models and relationships
Relationships on very large tables cost memory, because the engine builds an index for each. Whole-number keys are cheapest; text keys and keys with many distinct values cost more. In Direct Lake and import models alike, a relationship on a high-cardinality key such as a transaction number between two large fact tables is usually a sign that the two facts should be combined or summarized in the warehouse. Keiko's model had no fact-to-fact relationships at all: sales and targets met only through their shared dimensions, which is how conformed dimensions are meant to work.
One-to-one relationships
One-to-one relationships, where each row on one side matches at most one row on the other, are rare in a good star. They usually mean that two tables describe the same thing and should be merged, for example a product table and a separate product-extras table with the same SKUs. Keiko found one in StockLine's export, a store table and a store-address table, and simply merged them into dim_store in the warehouse, which removed a relationship from the model and made the store fields easier to find. Marisol's exception was when one of the two tables changes far more often than the other, or comes from a different system with different ownership, in which case keeping them apart in the warehouse can be worth it, but they should still meet the model as one dimension.
Relationship problems that look like measure problems
Many questions that arrive as "the measure is wrong" turn out to be relationship questions. A measure that shows the same value in every row of a table usually means the table's column is not related to the fact, so its filter never reaches the measure. A blank row at the bottom of a visual means orphaned keys. A total that does not equal the sum of its rows can be a many-to-many overlap, as in Keiko's household report, or a measure whose logic is not additive, such as a distinct count. Marisol taught Keiko to open the model diagram before touching any DAX, trace the path from the column on the visual to the fact table, and only then look at the formula.
Common mistakes
MistakeMake every relationship bidirectional so filters always work.
InsteadUse single direction by default; bidirectional filters cause ambiguity, slow queries and odd slicers.
MistakeA many-to-many suggestion means the model needs a many-to-many relationship.
InsteadIt usually means duplicate keys on the dimension; fix the data in the warehouse.
MistakeA total smaller than the sum of rows is a bug.
InsteadWith many-to-many bridges, rows can overlap; the total counts each member once.
MistakeLoad a role-playing date table twice for every extra date.
InsteadOne date table with an inactive relationship and USERELATIONSHIP in a few measures is often enough.
Summary and key terms
- Relationships carry filters from one table to another every time a measure is evaluated.
- Aim for one-to-many relationships from dimensions to facts with single cross-filter direction.
- Check that the one side has unique keys and the many side has no orphaned keys before relating tables.
- Bridge tables model real many-to-many rules; totals can be smaller than the sum of overlapping rows.
- Only one active path may join two tables; inactive relationships are activated in measures with USERELATIONSHIP.
- Hide keys, sort months, set data categories, summarize-by, formats, hierarchies and folders, and mark the date table.
- Relationship
- A link between columns of two tables that carries filters between them.
- Cardinality
- Whether a relationship is one-to-many, one-to-one or many-to-many.
- Cross-filter direction
- Whether filters travel one way or both ways across a relationship.
- Inactive relationship
- A relationship that is used only when a measure activates it.
- Orphaned key
- A key in a fact table that has no matching row in the dimension.
- Sort by column
- A property that sorts one column by the values of another.
- Date table
- A table marked so time intelligence functions use it.
Practice problems
Work each problem on paper first, then reveal the answer to check.
Which direction should most relationships filter?
Show answer
Single direction, from the dimension to the fact.
What does it usually mean when Power BI offers a many-to-many relationship between a dimension and a fact?
Show answer
The dimension key has duplicates.
Why can a household total be smaller than the sum of its rows?
Show answer
Members in several households are counted in each row but once in the total.
How does a measure use an inactive relationship?
Show answer
With USERELATIONSHIP inside CALCULATE.
Why set summarize-by to none on StoreId?
Show answer
So dragging it into a visual lists stores instead of summing their numbers.
Lesson quiz · 5 questions
Score 60% or more to complete this lesson.
Create a free account to save your progress, take quizzes and earn a certificate.