
MSAZ-311 · Lesson 11 of 12 · 20 min
Querying and analyzing data
▶ Video coming soon A video version of this lesson is on the way.
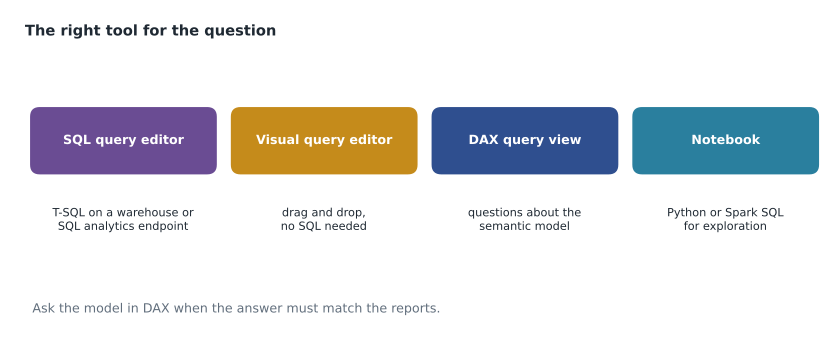
By the eleventh model session, on the morning of Thursday, November 12, the hub had clean tables, a star schema and a secured model. Marisol now wanted Keiko to answer Grace's original question herself, using the tools that Fabric gives analysts for exploring data. The DP-600 outline calls this exploring and analyzing data, and it expects candidates to know which tool to reach for: SQL against the warehouse, the visual query editor, DAX against the model, or a notebook.
The SQL query editor
Every warehouse and SQL analytics endpoint has a query editor in the browser. It runs T-SQL, shows results in a grid, can save a query as a view, and can open results in Excel or visualize them quickly. Queries can join across warehouses and lakehouse endpoints in the same workspace with three-part names. Keiko started with the gross margin by store for the last fiscal quarter, which in Harrow & Finch's calendar ran from August 1 to October 31, 2026.
SELECT s.StoreName, s.Region,
       SUM(f.SalesAmount)                                   AS Sales,
       SUM(f.SalesAmount - f.CostAmount)                    AS Margin,
       CAST(SUM(f.SalesAmount - f.CostAmount) * 100.0
            / NULLIF(SUM(f.SalesAmount), 0) AS decimal(5,1)) AS MarginPer100
FROM dbo.fact_sales AS f
JOIN dbo.dim_store   AS s ON s.StoreKey = f.StoreKey
JOIN dbo.dim_date    AS d ON d.DateKey  = f.DateKey
JOIN dbo.dim_product AS p ON p.ProductKey = f.ProductKey
WHERE d.FiscalQuarter = 'FY2026 Q3' AND p.Category = 'Paint'
GROUP BY s.StoreName, s.Region
ORDER BY MarginPer100;
Window functions make comparisons easy in SQL. RANK() OVER (ORDER BY Margin DESC) ranks stores; SUM(Sales) OVER (PARTITION BY Region) gives each store's regional total on the same row; LAG(Sales) OVER (ORDER BY Month) returns the previous month's value. Keiko used LAG to compare each store's paint margin with the same quarter a year earlier and found four stores where it had fallen by more than three points.
The visual query editor
Not everyone who needs data writes SQL. The visual query editor, also available on warehouses and SQL analytics endpoints, builds queries with Power Query-style steps: drag tables onto a canvas, merge them, choose columns, filter and group, and the editor generates the SQL. A buyer on Grace's team, Tomás, built a list of paint SKUs whose cost had risen in the October price files without writing a line of code, and saved it as a view that Keiko could reuse. The editor is limited compared with hand-written SQL, but it lowers the barrier to answering simple questions directly.
The DAX query view
When the question is about numbers that reports show, the semantic model is the better source, because its measures already encode the business rules: returns netted off, the unknown product included, fiscal calendars applied. The DAX query view in Power BI Desktop, also available for models in the service, runs DAX queries that start with EVALUATE and return a table. It can define temporary measures with DEFINE, which makes it the natural place to test a new measure before adding it to the model, and it can generate quick queries, such as the top rows of a table or a measure's definition.
DEFINE
    MEASURE fact_sales[Shrink Cost] =
        CALCULATE ( SUM ( fact_inventory_adjustment[CostChange] ),
                    fact_inventory_adjustment[ReasonKey] IN { 3, 4 } )   -- damage and unexplained loss
EVALUATE
SUMMARIZECOLUMNS (
    dim_store[StoreName],
    TREATAS ( { "FY2026 Q3" }, dim_date[FiscalQuarter] ),
    TREATAS ( { "Paint" }, dim_product[Category] ),
    "Sales", [Total Sales],
    "Margin Pct", [Gross Margin Pct],
    "Shrink Cost", [Shrink Cost]
)
ORDER BY [Margin Pct] ASC
SUMMARIZECOLUMNS is the workhorse of DAX queries: it groups by the columns listed, applies the filters given, and evaluates the named expressions for each group, much as a report visual does. TREATAS applies a list of values as a filter on a column. Because the query used the model, it respected the model's security too; when Keiko ran it with View as for the Store 12 manager, it returned one row.
Notebooks for exploration
A notebook suits exploration that needs statistics or charts beyond what SQL and DAX make easy. Spark DataFrames have describe and summary methods for quick statistics, and a pandas DataFrame, created from a Spark one with toPandas for a small result, works with the usual Python charting libraries. Fabric notebooks can also read a semantic model directly through the semantic link library, so an analyst can pull a measure's values by store into Python with the model's business rules intact. Keiko used a notebook to look for unusual days: store and date combinations whose paint sales were far from that store's normal level.
# Flag unusual days: sales far from the store's typical day (median and spread)
from statistics import median

daily_paint_sales = {   # one store, 14 days in October (dollars)
    "Oct 01": 2_120, "Oct 02": 2_340, "Oct 03": 2_010, "Oct 04": 2_890, "Oct 05": 3_120,
    "Oct 06": 2_200, "Oct 07": 2_150, "Oct 08": 2_280, "Oct 09": 9_870, "Oct 10": 2_950,
    "Oct 11": 3_010, "Oct 12": 2_180, "Oct 13": 2_090, "Oct 14": 2_260,
}
values = list(daily_paint_sales.values())
mid = median(values)
mad = median(abs(v - mid) for v in values)       # median absolute deviation: a robust spread

for day, v in daily_paint_sales.items():
    score = (v - mid) / mad
    if abs(score) > 10:
        print(f"{day}: {v:,} dollars is {score:.1f} spreads from the median of {mid:,.0f}")
print(f"Median {mid:,.0f}, median absolute deviation {mad:,.0f}")Oct 09: 9,870 dollars is 46.1 spreads from the median of 2,270 Median 2,270, median absolute deviation 165
What this code does
The example holds fourteen days of paint sales for one store. It finds the median day and a robust measure of how far days usually are from it, the median absolute deviation, which a single extreme day cannot distort the way it distorts an average. It then flags any day more than ten of those spreads from the median. The output flags October 9, at 9,870 dollars, as far outside the store's normal range, and prints the median of 2,270 and the spread of 165 used for the test.
The flagged day was not an error: October 9 was a contractor's bulk order for a new apartment building, recorded correctly. But the analysis mattered for Grace's question, because that one order had lifted the store's quarterly sales and, at a negotiated contractor price, lowered its margin rate. Keiko added a contractor flag to the promotion dimension so that future reports could separate contractor orders from retail sales.
Copilot and other helpers
Fabric offers Copilot in several of these tools. In the SQL query editor it can suggest and explain T-SQL; in notebooks it can write and explain code; in Power BI it can answer questions using the model and draft report pages; and in the DAX query view it can write queries from a description. Marisol's advice was to treat its output like a colleague's first draft: useful, often right, and always to be checked against a known answer before anyone relies on it. Copilot respects the user's permissions and the model's security, and it works best on models with good table and measure descriptions, which is one more reason Keiko had written them.
Answering Grace
By lunchtime Keiko had the answer. Of 23 stores, four had lost more than three points of paint margin compared with the same quarter a year earlier. In two, the cause was cost: a supplier price increase in July that had not been passed on to shelf prices. In one, it was mix: the store sold far more of a low-margin contractor line. In the fourth, Store 15, it was shrink, with damaged stock written off after a roof leak in August. Each finding pointed to a different fix, which was exactly why Grace had asked for price, mix and shrink to be separated.
Worked problem
Splitting a margin change into price and mix
At one store, paint sales last year were 120,000 dollars at a 40 per 100 margin (48,000 dollars). This year sales are again 120,000, but the contractor line, with a 25 per 100 margin, has grown from 20,000 to 50,000 dollars of the total, while the retail lines kept their 43 per 100 margin. What is this year's margin, and how much of the change is due to mix?
Show solution
- Last year: retail 100,000 at 43 per 100 is 43,000, contractor 20,000 at 25 per 100 is 5,000; total 48,000, or 40 per 100.
- This year: retail 70,000 at 43 per 100 is 30,100, contractor 50,000 at 25 per 100 is 12,500; total 42,600.
- 42,600 ÷ 120,000 = 0.355, so 35.5 per 100.
- Each line's own margin did not change, so the whole drop, from 48,000 to 42,600 dollars, is mix: 5,400 dollars, or 4.5 points.
Answer: This year's margin is 42,600 dollars, 35.5 per 100 of sales; the 5,400-dollar fall is entirely due to mix.
Sharing what was found
Keiko presented the four findings to Grace as a report page built on Sales Overview, not as a spreadsheet of query results, so that Grace could filter it herself and the numbers would match every other report. The queries she had written along the way were saved: the SQL ones as views in wh_sales, the DAX ones as a file in the model's Git folder, and the notebook in the FDH Sales Dev workspace with a markdown cell explaining its purpose. Marisol pointed out that this was the analytics engineer's job in miniature: answer the question once, then make the answer repeatable.
Profiling data before trusting it
Exploring data also means checking it. Before presenting anything to Grace, Keiko profiled the paint rows she had used. In the Power Query editor and in dataflows, column quality, column distribution and column profile views show the share of valid, error and empty values, the number of distinct values and a histogram for each column, which is a quick way to spot a column that is mostly empty or a code that appears far too often. In SQL, a few queries did the same job: counts of nulls per column, the minimum and maximum of every date and amount, and the number of distinct SKUs by month. One query showed that the August price file for a paint supplier had been loaded with unit costs in cents rather than dollars, which made its products look loss-making for one month; the fix went into the dataflow's cleaning rules, and the analysis was rerun.
Query performance for analysts
Analysts' queries share the capacity with everything else, so Marisol added a few habits. Filter by date before anything else, because date filters let the warehouse skip whole files. Select only the columns needed. Use the query insights views to see how long recent queries took and which ones read the most data. Save repeated exploratory queries as views, so the next person does not rewrite them with small differences. And for heavy exploration, such as scanning three years of sales lines in a notebook, run the work outside the morning reporting window, which the November 5 throttling had made everyone remember.
In the DAX query view the equivalent habit is to test measures on a narrow filter first, such as one store and one month, then widen the filter once the result is right. The performance analyzer in Power BI Desktop records how long each visual's query took and lets the DAX be copied into the query view or into DAX Studio, which MSAZ-312 covers when it turns to optimizing models at enterprise scale.
Grace asked one last question at the end of the meeting: could store managers explore like this themselves? Marisol's answer was yes, within limits. The Explore feature in Power BI lets a report reader open a visual's data in a lightweight, ad hoc view and pivot it without editing the report, and Copilot can answer questions in plain language on the same model. Both respect the StoreManagers role, so a manager exploring would still see only their own store. What managers would not get was access to the warehouse or notebooks, which stay with analysts who understand the tables underneath.
Common mistakes
MistakeQuery the warehouse for every reporting number.
InsteadWhen the answer must match reports, query the semantic model, whose measures encode the business rules.
MistakeAverages are the best way to spot unusual days.
InsteadOne extreme day distorts the average; the median and median absolute deviation are more robust.
MistakeCopilot's queries can be used without checking.
InsteadTreat Copilot output as a draft and check it against a known answer.
MistakeA drop in margin rate always means prices fell.
InsteadMargin can fall through cost, mix or shrink; separate them.
Summary and key terms
- The SQL query editor runs T-SQL on warehouses and SQL endpoints, and can save views; window functions handle ranks and comparisons.
- The visual query editor builds queries without code for simple questions.
- The DAX query view runs EVALUATE queries against the model, with temporary measures and the model's security.
- Notebooks suit statistics and exploration, and can read semantic models through semantic link.
- Copilot helps draft SQL, DAX and code but needs checking.
- Separate margin changes into price, mix and shrink, and share results through the shared model.
- SQL query editor
- The browser editor for T-SQL queries on warehouses and SQL analytics endpoints.
- Visual query editor
- A no-code editor that builds SQL queries with drag-and-drop steps.
- DAX query view
- A view for writing and running DAX queries against a semantic model.
- EVALUATE
- The DAX keyword that starts a query returning a table.
- SUMMARIZECOLUMNS
- A DAX function that groups by columns and evaluates expressions for each group.
- Semantic link
- A library that lets Fabric notebooks read semantic models and their measures.
- Mix effect
- A change in a total ratio caused by a shift in the share of parts with different ratios.
Practice problems
Work each problem on paper first, then reveal the answer to check.
When should an analyst query the semantic model rather than the warehouse?
Show answer
When the answer must match the reports, because the model's measures encode the business rules.
Which DAX keyword starts a query?
Show answer
EVALUATE.
How can a temporary measure be tested without changing the model?
Show answer
Define it with DEFINE MEASURE in the DAX query view.
Why use the median absolute deviation to find unusual days?
Show answer
It is not distorted by the extreme values being looked for.
What were the three causes Grace wanted separated?
Show answer
Price or cost, mix and shrink.
Lesson quiz · 5 questions
Score 60% or more to complete this lesson.
Create a free account to save your progress, take quizzes and earn a certificate.