
MSAZ-311 · Lesson 1 of 12 · 21 min
Getting data into Fabric
▶ Video coming soon A video version of this lesson is on the way.
Keiko Tanabe had spent seven years at Harrow & Finch Home Supply in Des Moines building the nightly sales report from SQL Server queries and a large Excel workbook. In October 2026 the company started the Finch Data Hub on Microsoft Fabric, and the foundations course, MSAZ-310, followed Keiko and the data engineer Ines Duarte through workspaces, OneLake, lakehouses and governance. This course follows Keiko into the work that the Fabric Analytics Engineer certification, exam DP-600, is mostly about: getting data ready for analysis and building the semantic models that reports use.
Her guide is Marisol Vega, the company's business intelligence lead, who joined from a grocery chain in the summer and has built Power BI models for a decade. Marisol agreed to run a series of afternoon "model sessions" on the hub's trial capacity, starting on Monday, October 26, 2026, while Nikolai Petrenko kept running the morning hub sessions on the engineering side. Marisol had one rule that she repeated so often that Keiko wrote it on a sticky note: "Decide the question before you decide the tool." Keiko plans to sit DP-900 in March 2027 and DP-600 in the autumn of 2027; the sessions are her head start.
What an analytics engineer does
Microsoft describes the Fabric analytics engineer as someone who designs, builds and deploys analytics solutions: they turn raw data into tables that analysts can trust, design semantic models with measures and security, and look after the reports and models in production. The role sits between the data engineer, who builds pipelines at scale, and the report author, who builds visuals. Many analytics engineers come from the report side, as Keiko did, and the hardest part of the transition is learning to work upstream: to fix a problem in the table that feeds a hundred reports rather than in each report.
The DP-600 exam reflects that mix. Microsoft's certification page lists three skill areas: maintaining a data analytics solution, preparing data, and implementing and managing semantic models. Preparing data is the largest. Third-party guides that track the outline report weights of about 25 to 30 for maintaining, 45 to 50 for preparing data and 25 to 30 for semantic models, in every 100 questions; the official study guide is the place to confirm the current weights before booking, because Microsoft updates them. This course covers most of preparing data and the core of semantic models; MSAZ-312 covers enterprise-scale model performance, and MSAZ-319 reviews the whole outline.
Start with the question
Marisol opened the first session with a question from Grace Oduya, the store operations director: which stores lost gross margin on paint last quarter, and was it price, mix or shrink? Keiko's old workbook could not answer it, because it had sales but not supplier costs, and costs lived in supplier price files that buyers saved in a shared folder. Marisol asked Keiko to list what the answer needed before talking about any Fabric feature.
| Data | Where it lives | How often it changes | Size |
|---|---|---|---|
| Sales lines | StockLine (SQL Server), already loaded to lh_raw by Ines | About 38,000 new rows a day | 41.2 million rows, 3 years |
| Supplier price files | CSV files in a shared folder, one per supplier per month | Monthly | About 60 files, 2,000 to 9,000 rows each |
| Products and categories | StockLine product tables | Daily, a few changes | About 48,000 SKUs |
| Stores and regions | StockLine store table and a regional spreadsheet | Rarely | 23 stores, 4 regions |
| Shrink adjustments | StockLine inventory adjustments | Daily | About 1,200 rows a day |
The list mattered because each kind of data suggests a different route into Fabric. Large, steadily growing tables from a database suit a bulk copy that runs on a schedule. A folder of messy CSV files suits a tool that can clean them as they arrive. A spreadsheet that one person edits suits something lightweight. Data that already sits in Azure storage might not need copying at all.
The main routes
Fabric offers several ways to bring data in, and the DP-600 outline expects candidates to choose among them. The first is the data pipeline, the orchestration tool of Data Factory in Fabric. A pipeline's copy activity moves data from a source to a destination at scale, with options for incremental loads, and the copy job is a simpler item that does the same with less configuration. Pipelines also run other work in order: a dataflow, a notebook, a stored procedure, then a notification if something fails.
The second is Dataflow Gen2, which uses Power Query, the same transformation engine that Keiko already knew from Excel and Power BI Desktop. A dataflow connects to a source, applies a series of transformation steps, and writes the result to a destination such as a lakehouse table or a warehouse. It suits analysts who want to shape data without writing code, and sources that need cleaning on the way in.
The third is the notebook, where Spark runs Python, Scala, R or SQL. Notebooks suit large volumes, complex logic and anything that benefits from code, such as deduplication rules or reusable functions. The fourth and fifth are the ones from MSAZ-310 that move no data at all or keep a copy in step automatically: shortcuts, which point at data where it already lives, and mirroring, which keeps a near real-time replica of a supported database in OneLake.
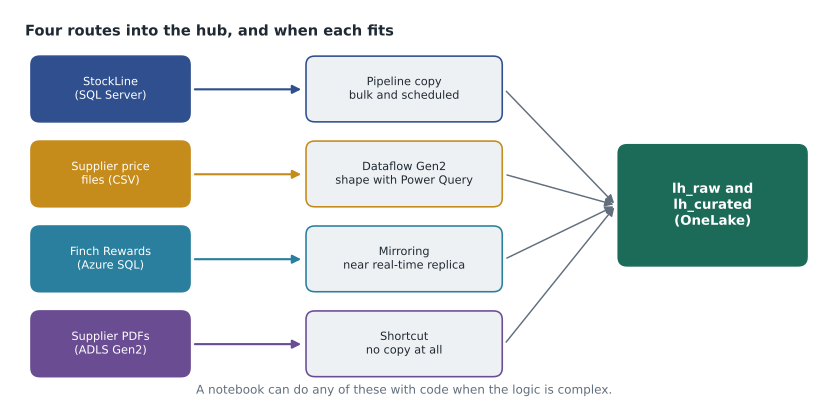
| Route | Good for | Watch for |
|---|---|---|
| Pipeline copy activity or copy job | Large tables, scheduled bulk or incremental loads, many sources | Little transformation; pair with a dataflow or notebook to shape data |
| Dataflow Gen2 | Cleaning and shaping with Power Query, no code, analyst-owned sources | Heavy volumes cost more capacity than a copy; check folding |
| Notebook | Complex logic, very large data, reusable code | Needs Spark skills; review and test like any code |
| Shortcut | Data already in OneLake, ADLS Gen2, S3 or other supported stores | No copy, so performance and availability depend on the target |
| Mirroring | Supported operational databases kept current in OneLake | Read-only replica; transformation happens afterwards |
Where the data lands
Choosing a route also means choosing a destination. In the hub, raw data lands in the lh_raw lakehouse exactly as received, cleaned tables live in lh_curated, and the gold star schema that reports use lives in the wh_sales warehouse. Marisol reminded Keiko of the reason from MSAZ-310: each layer has one job, so a strange number in a report can be traced back step by step. A dataflow that writes cleaned supplier prices straight into lh_curated is fine, as long as the raw files are also kept somewhere, because a cleaning rule that turns out to be wrong can then be fixed and rerun.
The destination type matters for what comes next. A lakehouse is written by Spark, pipelines and dataflows, and read through its SQL analytics endpoint; a warehouse accepts T-SQL inserts, updates and deletes and multi-table transactions. If the analytics engineer will maintain the star schema with T-SQL stored procedures, a warehouse is the natural home; if Spark notebooks will build it, a lakehouse is. Both store Delta tables in OneLake, so a semantic model can read either.
Load once, or load what changed
A full load copies everything every time. It is simple and always correct, but it wastes time and capacity when only a sliver of the data has changed. An incremental load copies only new or changed rows, usually by remembering a watermark, such as the highest modified date loaded so far, and asking the source for rows after it. Ines loaded the three-year sales history once, then switched the daily pipeline to incremental, which cut the nightly run from 47 minutes to 4.
# Compare a nightly full reload with an incremental load (illustrative numbers)
history_rows = 41_200_000          # rows already loaded
new_rows_per_day = 38_000
rows_per_minute = 900_000          # copy throughput seen in the test

full_minutes = (history_rows + new_rows_per_day) / rows_per_minute
incremental_minutes = new_rows_per_day / rows_per_minute

print(f"Full reload each night: {full_minutes:.1f} minutes")
print(f"Incremental load:       {incremental_minutes:.2f} minutes")
print(f"Rows copied per year, full:        {(history_rows + new_rows_per_day) * 365:,}")
print(f"Rows copied per year, incremental: {new_rows_per_day * 365:,}")Full reload each night: 45.8 minutes Incremental load: 0.04 minutes Rows copied per year, full: 15,051,870,000 Rows copied per year, incremental: 13,870,000
What this code does
The example takes the size of the sales history, the number of new rows each day and a copy speed measured in the test. It works out how long a full reload of the whole table would take each night and how long copying only the new rows would take, and then how many rows each approach copies in a year. The output shows the full reload taking about 46 minutes against a fraction of a minute, and copying roughly a thousand times as many rows, which is why the daily load switched to incremental after the one-off history load.
The real pipeline took four minutes rather than a few seconds because every run has fixed overhead: starting, connecting to the source through the data gateway, checking the watermark and writing the Delta log. Incremental loads have one trap that Marisol made Keiko repeat: a watermark only finds rows whose modified date moves forward. If the source can delete rows, or can change a row without updating its modified date, an incremental load will miss the change, and a periodic full comparison is needed to catch it.
Connections and gateways
Fabric connects to sources through connections that store the server, the authentication method and the credential. Cloud sources such as Azure SQL Database or an ADLS Gen2 account can be reached directly. Sources on the company network, such as StockLine's SQL Server at head office, are reached through an on-premises data gateway installed on a server inside the network, or, for some pipelines, through a virtual network data gateway. The connection is shared with the people and items that need it, and the person who creates it decides who else may use it.
Keiko's first practical task was small: create a connection to the shared folder of supplier price files so a dataflow could read it in the next session. She chose to authenticate with a service account that had read-only access to the folder, rather than her own account, so the dataflow would keep working if she was away or changed jobs. Marisol approved and added one more rule: name connections after the source and its purpose, such as conn-supplier-prices-read, so that whoever audits them in a year understands them.
Worked problem
Which route for the shrink adjustments?
Grace's question also needs StockLine's inventory adjustments: about 1,200 rows a day, already in the StockLine database that Ines copies nightly, with a reliable modified-date column and no deletions. Keiko must choose how to bring them into lh_raw.
Show solution
- The source is a database table on the company network, so the route needs a connection through the existing data gateway.
- Rows are only ever added or updated with a modified date, and none are deleted, so an incremental load with a watermark on the modified date is safe.
- The data needs no reshaping on the way in; cleaning happens later in lh_curated.
- Ines already runs a nightly pipeline against StockLine, so adding a copy activity for the adjustments table keeps all StockLine loads in one place and one schedule.
Answer: Add an incremental copy activity to Ines's existing nightly StockLine pipeline, landing the adjustments in lh_raw, with the modified date as the watermark.
A note on cost
Every route consumes capacity units from the hub's capacity, and the trial capacity hides that because it is free for 60 days. Marisol asked Keiko to look at the Capacity Metrics app after each experiment, as Nikolai had shown in MSAZ-310, so she would know before the F16 pilot started in January 2027 which of her loads were expensive. A dataflow that runs every 15 minutes over a large table can cost more than the reports that read it.
What the first session settled
By the end of the afternoon Keiko had a plan for Grace's question. Sales were already in lh_raw. The adjustments would join Ines's pipeline. The supplier price files would go through a dataflow, because they needed the most cleaning and Keiko could build it herself. Products and stores would be cleaned with SQL in the warehouse. Marisol said that the next session would be the dataflow, and that the one after would show what the warehouse could do with T-SQL.
Common mistakes
MistakeA dataflow is always the easiest way to load any table.
InsteadDataflows suit shaping with Power Query; large, plain copies are cheaper and faster with a pipeline copy activity or copy job.
MistakeIncremental loads never miss changes.
InsteadA watermark misses deletions and changes that do not update the modified date; plan a periodic full comparison.
MistakeShortcuts copy data into OneLake.
InsteadShortcuts point at data where it lives; mirroring keeps a replica, and copies move data.
MistakePersonal accounts are fine for scheduled connections.
InsteadUse a service account or other non-personal identity with least privilege, so loads survive people changing roles.
Summary and key terms
- The analytics engineer prepares trusted tables and builds semantic models with measures and security; DP-600 tests these skills.
- Start from the business question and list the data it needs before choosing tools.
- Pipelines and copy jobs move data at scale; Dataflow Gen2 shapes data with Power Query; notebooks run code; shortcuts and mirroring avoid or automate copying.
- Incremental loads with a watermark save time and capacity but can miss deletions and silent changes.
- Connections store credentials; on-premises sources need a data gateway.
- Each load consumes capacity units, so measure experiments before the paid capacity starts.
- Analytics engineer
- A role that prepares data, builds semantic models and manages analytics content in Fabric.
- Copy activity
- A pipeline activity that moves data from a source to a destination.
- Copy job
- A Fabric item that copies data with simpler configuration than a pipeline.
- Dataflow Gen2
- A Fabric item that transforms data with Power Query and writes it to a destination.
- Incremental load
- Loading only rows that are new or changed since the last load.
- Watermark
- A stored value, such as the latest modified date loaded, used to find new rows.
- Data gateway
- Software that lets Fabric reach data sources on a private network.
Practice problems
Work each problem on paper first, then reveal the answer to check.
What should Keiko list before choosing any Fabric feature?
Show answer
The data the business question needs, where it lives, how often it changes and how big it is.
Which route suits a folder of messy CSV files that an analyst wants to clean without code?
Show answer
Dataflow Gen2.
Why might an incremental load miss a change?
Show answer
The source deleted the row or changed it without updating the modified date used as the watermark.
Why use a service account for a scheduled connection?
Show answer
So loads keep working when a person is away or changes jobs, with only the access the load needs.
Where does the hub keep data exactly as received?
Show answer
In the lh_raw lakehouse.
Lesson quiz · 5 questions
Score 60% or more to complete this lesson.
Create a free account to save your progress, take quizzes and earn a certificate.