
MBA-603 · Lesson 5 of 12 · 22 min
Analytics and data-driven decision making
Cedarline's online team has run a small experiment, and its results arrive just in time for the fifth session. For three weeks, half the visitors to the website's product pages saw a banner that said every Cedarline product is repaired free for life, and half saw the page without it. The team believes the banner worked, and it wants to add the message to every page and to the paid advertising. The chief financial officer wants to know whether the effect is real, how large it is and what it is worth. Dr. Marchetti uses the experiment to frame the lesson: analytics is valuable only when it changes a decision, and the most valuable analytics answers a causal question, what will happen if we do this, rather than a descriptive one.
From reports to decisions
Thomas Davenport and Jeanne Harris, in their 2007 book Competing on Analytics, argued that some firms build their strategies around the systematic use of data and quantitative analysis, and that such firms outperform their rivals in the activities where they apply it. The book described a maturity path from organizations that are analytically impaired, with poor data and no analytical culture, to analytical competitors that use analytics across the enterprise with strong executive support. Another common framework, popularized by the research firm Gartner, distinguishes four kinds of analytics: descriptive analytics tells what happened, diagnostic analytics why it happened, predictive analytics what is likely to happen, and prescriptive analytics what the organization should do about it.
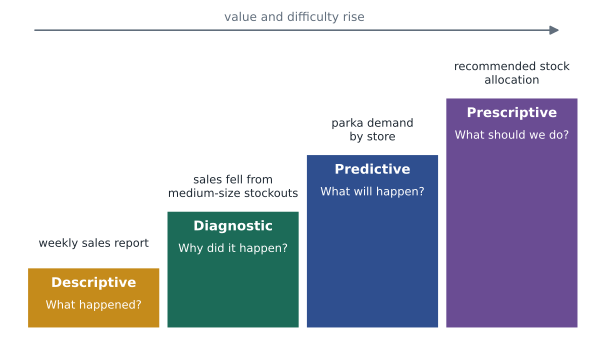
Most organizations spend most of their analytics effort on descriptive work: reports, dashboards and monthly packs that show what happened. These are necessary, but Dr. Marchetti warns that they are often produced out of habit and read by nobody. She asks each member of the cohort to list the reports they receive and the decisions each one informs. Owen Tremblay, finance manager at Prairie Ridge Energy, a gas processor with wind and solar farms, counts 23 regular reports and can link only nine to a decision. The others exist because someone once asked for them.
A better starting point is the decision. A decision-centric approach asks which recurring decisions matter most to the strategy, who makes them, what information would change them and how quickly the information is needed. For Cedarline, the important recurring decisions include how much of each style and size to buy months ahead, how to allocate stock to stores and online, when and how deeply to mark down, which customers to target with which offers, how to staff stores and the care team, and which repairs to accept and how to price them. Each decision has an owner, a rhythm and a value at stake, and analytics investment should follow that value.
Correlation, causation and experiments
The hardest analytical questions are causal. Did the loyalty program make customers spend more, or do customers who spend more join loyalty programs? Did a new store layout raise sales, or did sales rise everywhere because of the weather? Observational data, records of what happened in the normal course of business, almost always mix the effect of an action with the reasons it was taken. Customers who see a promotion differ from those who do not; stores chosen for a pilot are usually chosen because their managers are keen.
Randomized experiments solve this by assigning the action by chance, so that the groups differ only in the action and in random noise. Online businesses run them constantly, often called A/B tests. Ron Kohavi, Diane Tang and Ya Xu, who led experimentation at Microsoft, Google and LinkedIn, describe in their 2020 book Trustworthy Online Controlled Experiments how large technology firms run thousands of experiments a year and find that most ideas, even those that experts are confident about, have no measurable effect or a negative one. The discipline is valuable precisely because intuition is a poor guide to what will work.
Cedarline's banner test is a simple example. The code below tests whether the difference in conversion between the two groups is larger than chance would explain, estimates a range for the true effect and translates that range into money.
import math
# A/B test: does a "repair it free for life" banner on product pages lift conversion?
visits_a, orders_a = 41_200, 1_030      # control page
visits_b, orders_b = 40_900, 1_145      # page with the repair banner
pa, pb = orders_a / visits_a, orders_b / visits_b
pooled = (orders_a + orders_b) / (visits_a + visits_b)
se = math.sqrt(pooled * (1 - pooled) * (1 / visits_a + 1 / visits_b))
z = (pb - pa) / se
p_value = math.erfc(abs(z) / math.sqrt(2))            # two-sided
se_diff = math.sqrt(pa * (1 - pa) / visits_a + pb * (1 - pb) / visits_b)
lo, hi = (pb - pa) - 1.96 * se_diff, (pb - pa) + 1.96 * se_diff
print(f"conversion A {pa:.2%}, B {pb:.2%}, relative lift {pb / pa - 1:.1%}")
print(f"z = {z:.2f}, two-sided p = {p_value:.4f}")
print(f"95% interval for the difference: {lo:.2%} to {hi:.2%}")
# What the lift is worth: 33 million product-page visits a year, average order 142, margin 48 per cent
annual_visits, order_value, margin = 33_000_000, 142, 0.48
for diff in (lo, pb - pa, hi):
    print(f"extra contribution for a lift of {diff * 100:.2f} points: {annual_visits * diff * order_value * margin / 1e6:.2f} million")
# Sample size per arm to detect a 0.25-point lift from 2.5 per cent with 80 per cent power, 5 per cent two-sided
p0, p1 = 0.025, 0.0275
z_a, z_b = 1.96, 0.8416
n = ((z_a * math.sqrt(2 * p0 * (1 - p0)) + z_b * math.sqrt(p0 * (1 - p0) + p1 * (1 - p1))) / (p1 - p0)) ** 2
print(f"visits needed per arm: {math.ceil(n):,}")conversion A 2.50%, B 2.80%, relative lift 12.0% z = 2.67, two-sided p = 0.0075 95% interval for the difference: 0.08% to 0.52% extra contribution for a lift of 0.08 points: 1.79 million extra contribution for a lift of 0.30 points: 6.74 million extra contribution for a lift of 0.52 points: 11.68 million visits needed per arm: 62,109
Conversion rose from 2.50 to 2.80 percent, a relative lift of 12 percent. The test statistic is 2.67 and the probability of seeing a difference this large by chance, if the banner had no effect, is less than one in a hundred. So the effect is probably real. But the plausible range for the true difference is wide, from 0.08 to 0.52 percentage points, and the value of the banner over a year ranges accordingly from about 1.8 million to 11.7 million dollars of contribution, with a central estimate of 6.7 million. The last line shows why: the test had about 41,000 visits per group, while detecting a lift of a quarter of a point reliably needs about 62,000 per group. The test was somewhat underpowered, and its central estimate should be treated with caution.
Dr. Marchetti lists the checks a careful analyst would make before the finance team books any benefit. Were visitors assigned randomly and did each group get about the number expected? A large imbalance, called a sample ratio mismatch, usually signals a bug. Did the team decide in advance how long to run the test, or did it stop when the result looked good? Stopping early when a result crosses a threshold inflates false positives. Is the effect stable over the three weeks, or did it fade as returning visitors got used to the banner, a novelty effect? Did the banner change what people bought, or only whether they bought, and did returns rise? And does the effect on product pages carry over to paid advertising, which reaches a different audience?
The recommendation the cohort reaches is to adopt the banner, which costs almost nothing, but to keep a small holdout group without it for several months to measure the lasting effect, and to test the message separately in advertising. That is how an experimentation culture works: decisions are made quickly, but the organization keeps measuring.
Predictive models and the cost of errors
Predictive analytics uses patterns in past data to estimate the probability of future outcomes: which customers will leave, which machines will fail, which transactions are fraudulent, which patients will be readmitted. The model produces a score, and the business must choose a threshold above which it acts. That choice is a business decision, not a statistical one, because it depends on the costs of the two kinds of error. A false positive is acting when there was no need: sending a retention offer to a customer who would have stayed. A false negative is failing to act when there was a need: losing a customer who could have been saved.
Cedarline's analysts have built a model to predict which Care members will not renew. The code scores ten test members and compares four thresholds, given that a retention offer costs 15 dollars, keeping a member is worth 120 dollars, and an offer saves about 40 percent of the members who would otherwise leave.
# Which Cedarline Care members will not renew? Scores from a churn model on 10 test members
# (score = predicted probability of leaving; left = what actually happened)
members = [(0.91, 1), (0.82, 1), (0.74, 0), (0.66, 1), (0.58, 0),
           (0.47, 1), (0.39, 0), (0.28, 0), (0.17, 0), (0.08, 0)]
offer_cost, saved_value, save_rate = 15, 120, 0.40   # a retention offer costs 15; saving a member is worth 120
def evaluate(threshold):
    tp = sum(1 for s, y in members if s >= threshold and y == 1)
    fp = sum(1 for s, y in members if s >= threshold and y == 0)
    fn = sum(1 for s, y in members if s < threshold and y == 1)
    tn = sum(1 for s, y in members if s < threshold and y == 0)
    value = tp * save_rate * saved_value - (tp + fp) * offer_cost
    return tp, fp, fn, tn, value
for t in (0.8, 0.6, 0.4, 0.2):
    tp, fp, fn, tn, v = evaluate(t)
    precision = tp / (tp + fp) if tp + fp else 0
    recall = tp / (tp + fn)
print(f"threshold {t:.1f}: TP {tp} FP {fp} FN {fn} TN {tn} precision {precision:.0%} recall {recall:.0%} value {v:5.0f}")threshold 0.8: TP 2 FP 0 FN 2 TN 6 precision 100% recall 50% value 66 threshold 0.6: TP 3 FP 1 FN 1 TN 5 precision 75% recall 75% value 84 threshold 0.4: TP 4 FP 2 FN 0 TN 4 precision 67% recall 100% value 102 threshold 0.2: TP 4 FP 4 FN 0 TN 2 precision 50% recall 100% value 72
A strict threshold of 0.8 targets only two members, both of whom were going to leave, so every offer is well aimed, but it misses half the leavers. Lowering the threshold to 0.4 catches all four leavers at the cost of two wasted offers, and gives the highest value, 102 dollars for these ten members. Going lower to 0.2 adds only wasted offers. Because saving a member is worth much more than an offer costs, the best threshold is fairly low, which is a general result: when false negatives are expensive relative to false positives, act on weaker signals. A real analysis would use thousands of members rather than ten and would estimate the save rate from an experiment, because the 40 percent figure is itself a causal claim.
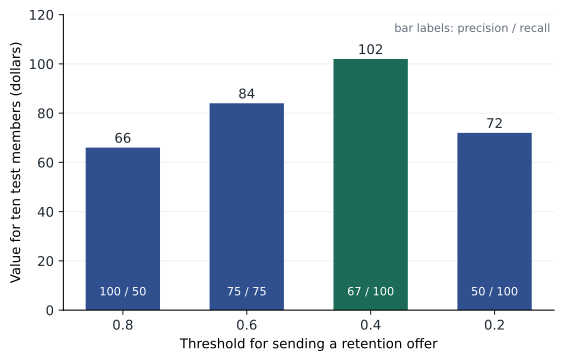
Model accuracy alone, the share of predictions that are right, is a poor guide for such decisions, especially when the outcome is rare. A model that predicted no member would ever leave would be right 60 percent of the time on these ten members and useless. Precision, the share of flagged cases that are real, and recall, the share of real cases that are flagged, describe the trade-off more usefully, and the business value calculation settles it.
Fairness and the limits of prediction
Predictions about people can be unfair even when the model is accurate overall. A model trained on past decisions can learn past biases; a model that uses postal or ZIP codes can act as a proxy for race or income; and a model can be accurate on average but much less accurate for small groups. Hana Kowalski describes a model Lakeview considered for predicting which patients would miss appointments, so that clinics could overbook their slots. It was accurate, but the patients it flagged were disproportionately low-income patients who relied on public transit, and overbooking their slots would have made their waits longer still. Lakeview used the model instead to offer those patients reminders and transportation help, which reduced missed appointments without penalizing anyone. The same prediction supported a different decision.
Dr. Marchetti's guidance is to test models for differences in error rates across relevant groups before using them for decisions about people, to prefer actions that help rather than penalize the people a model flags, and to keep a person in the loop for decisions that significantly affect individuals. Lessons 6 and 12 return to these questions in the context of AI governance and regulation.
Building an analytical organization
Analytics capability is not only a matter of tools and analysts. It needs data people trust, which was the subject of lesson 4; analysts who understand the business; managers who know how to ask good questions and read the answers; and decision processes that use the results. Many firms organize analysts in a hub-and-spoke model, with a central team that sets standards, builds shared data products and handles complex work, and analysts embedded in business units who know the decisions. Small firms often begin with a central team and move toward embedded analysts as demand grows.
Culture matters as much as structure. In many meetings the most senior person's opinion settles the question, a pattern that people in the analytics community joke about as following the HiPPO, the highest-paid person's opinion. An analytical culture does not mean that data always overrule judgment; it means that claims are tested where they can be, that people state in advance what evidence would change their minds, and that leaders are willing to be shown wrong. Daniel Osei says this was the biggest change when Northfield began analyzing machine data: supervisors who had run presses for twenty years were sure they knew why defects happened, and some were right and some were not, and the data gave them a way to find out without anyone losing face.
Worked problem
Was the loyalty program worth it?
Grace Mwangi's colleagues at Fairway report that loyalty members spend 2.3 times as much per year as non-members and conclude that the program has more than doubled spending. The program costs about 14 million a year. How should Fairway estimate the program's real effect?
Show solution
- Recognize selection: heavy shoppers are more likely to join, so the 2.3 ratio mixes the program's effect with who joins.
- Compare members before and after joining: track spending for the same households in the months before and after they joined, against similar households that did not join in the same period.
- Use natural experiments or tests: compare stores or regions where the program launched at different times, or randomize offers within the program to see which change behavior.
- Translate the estimated causal lift into contribution and compare it with the 14 million cost, including the value of the data for other decisions.
Answer: The 2.3 ratio overstates the effect. A before-and-after comparison with a matched control group, or staggered launch dates, would give a credible estimate of incremental spending, which Fairway should then convert to contribution and compare with the program's cost.
Common mistakes
MistakeA dashboard is analytics.
InsteadDashboards describe; analytics creates value when it changes a decision.
MistakeA statistically significant result tells us the size of the effect.
InsteadIt tells us the effect is probably not zero; the confidence interval shows the plausible size, which may be wide.
MistakeThe best model threshold is 0.5.
InsteadThe threshold should balance the business costs of false positives and false negatives.
MistakeMembers spend more than non-members, so the program works.
InsteadSelection can explain much of the difference; causal effects need experiments or careful comparisons.
Summary and key terms
- Analytics ranges from descriptive and diagnostic to predictive and prescriptive, with value and difficulty rising along the way.
- Start from important recurring decisions and invest in the analytics that would change them.
- Causal questions need randomized experiments or careful comparisons, because observational data mix effects with the reasons actions were taken.
- A/B tests need adequate sample sizes, fixed stopping rules and checks for sample ratio mismatch and novelty effects; confidence intervals show how large an effect may be.
- Prediction thresholds should reflect the business costs of false positives and false negatives; precision and recall describe the trade-off.
- Models about people need fairness checks, and an analytical culture tests claims rather than deferring to seniority.
- Descriptive analytics
- Analysis of what has happened.
- Prescriptive analytics
- Analysis that recommends an action, often by optimization.
- A/B test
- A randomized experiment comparing two versions of a page, offer or process.
- Confidence interval
- A range of plausible values for an effect, given the data.
- Precision
- The share of cases a model flags that are true cases.
- Recall
- The share of true cases that a model flags.
Practice problems
Work each problem on paper first, then reveal the answer to check.
Why can stopping an A/B test as soon as it looks significant be misleading?
Show answer
Repeatedly checking and stopping at the first significant result inflates the chance of a false positive.
In the churn example, why is the best threshold low?
Show answer
Keeping a member is worth far more than an offer costs, so missing leavers is more expensive than wasting offers.
Give one sign that an A/B test has a technical problem.
Show answer
A sample ratio mismatch: group sizes differ substantially from what the random assignment should produce.
What is the difference between precision and recall?
Show answer
Precision is the share of flagged cases that are real; recall is the share of real cases that are flagged.
Lesson quiz · 5 questions
Score 60% or more to complete this lesson.
Create a free account to save your progress, take quizzes and earn a certificate.