
LES-115 · Lesson 3 of 12 · 20 min
Measuring victimization: the National Crime Victimization Survey and reporting to police
▶ Video coming soon A video version of this lesson is on the way.
Linh Tran has a question before the lesson starts. In LES-102 the class learned that police statistics miss a great deal of crime, the so-called dark figure. 'If most crime is never reported,' she asks, 'how does anyone know how much there is?' Brooks says that is exactly what today's lesson is about, and that the answer matters for victims as much as for researchers. Every unreported crime is a person who decided, for some reason, that calling the police was not worth it. Understanding those reasons is the first step toward changing them.
Two ways of counting
There are two main ways to count crime. Police-reported statistics count incidents that come to the attention of the police and are recorded. In the United States, police agencies report to the FBI's Uniform Crime Reporting program, which since 2021 has collected data only through the National Incident-Based Reporting System, known as NIBRS. Police data are detailed and timely, cover every community and include crimes against businesses and homicides. But they count only what victims report and police record.
Victimization surveys go around the police entirely. They ask a large random sample of people whether they have been victims of crime during a recent period, whether they reported it, and what happened afterward. Because they ask people directly, they capture crimes that never reached the police. They also ask about the effects of crime, contact with victim services, and fear and perceptions of safety. Their limits are the mirror image of police data: they rely on people remembering and being willing to disclose, they cannot count homicides or crimes against businesses, and their samples are too small to say much about a single city such as Port Ardent.
The National Crime Victimization Survey
The Bureau of Justice Statistics has run the National Crime Victimization Survey since 1973, when it began as the National Crime Survey. Households are selected at random and stay in the sample for three and a half years, and every person aged 12 or older in the household is interviewed every six months, in person or by telephone. The survey asks about rape and sexual assault, robbery, aggravated and simple assault, personal larceny, household burglary, motor vehicle theft and other theft. It does not cover homicide, crimes against businesses or victims younger than 12.
The 2023 results are a useful snapshot. The rate of violent victimization was about 22.5 per 1,000 people aged 12 or older, similar to the 2022 rate, and there were about 13.6 million property victimizations. Only about 8 in every 100 victims of violent crime received help from a victim service provider other than the police.
How much is reported
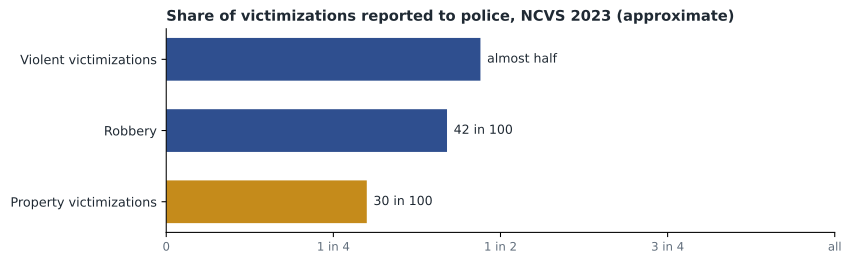
The most important figures for police are the reporting rates. The 2023 survey found that almost half of violent victimizations were reported to police, and about 30 in every 100 property victimizations. Reporting rates vary from year to year and by crime type, and some estimates, especially for rape and sexual assault, rest on small samples and have wide margins of error.
Why do people not report? The surveys ask, and the answers are consistent across years and countries. The most common reason is that the crime seemed too minor to be worth reporting, or that nobody was hurt. Many victims of property crime believe the police could not or would not do anything, for example that stolen property would never be found. Some victims deal with the matter another way, for instance through a school, an employer or the family. Some consider it a private matter. Others fear reprisal from the offender, do not want the offender, often someone they know, to get into trouble, or feel ashamed or worried that they will not be believed. For sexual assault and intimate partner violence, these last reasons are much more common.
Brooks asks the class which of those reasons the police can influence. Several, the class decides. Victims who believe the police will not take them seriously, will not do anything or will treat them badly are making a prediction based on what they have heard or experienced. Every interaction an officer has with a victim, and every story that victim tells others afterward, shapes those predictions for the whole community. Amara Okafor points out that reporting also depends on practical things: whether a victim can report online, whether someone speaks their language, whether they can report at a hospital or a victim services agency instead of a police station.
Why reporting matters, and why it is not always the goal
Reporting matters because the police cannot investigate what they do not know about, and patterns such as a series of break-ins or repeated assaults by the same person stay invisible. It also matters to victims directly, because many forms of help depend on it. The Ohio Victims of Crime Compensation Program requires that the crime be reported to law enforcement and that the victim cooperate with the investigation.
Brooks adds an important caution. Victim services exist for victims, whether or not they report. A woman who has been sexually assaulted may want medical care, counseling and safety planning without a police investigation, and she is entitled to that choice. Many hospitals offer sexual assault nurse examiner programs that can collect and store forensic evidence so that a victim can decide later whether to go to police. Pressuring a victim to report can repeat the loss of control that the crime itself caused. The goal is to make reporting possible, safe and worthwhile, not to make it compulsory.
What surveys say about the effects of crime
Victimization surveys do more than count incidents. They also ask victims how the crime affected them, and the answers are a useful reminder that even crimes the justice system treats as minor can have real consequences. Victims commonly report feeling angry, upset, confused or frustrated, and a substantial share report feeling more fearful or more cautious afterward, having trouble sleeping, or worrying about their safety at home. Victims of violence are more likely than victims of property crime to report lasting effects, and a minority of violent crime victims describe symptoms consistent with post-traumatic stress, which the class will study in the next lesson. Many victims also report practical costs: time off work, medical bills, repairs, replacing documents and cards, and hours spent dealing with insurers and banks.
Ruth Lindqvist's losses illustrate the point. Her insurer paid for most of the stolen tools and the broken door, but she paid a deductible of 1,000 dollars, lost two days of sales while the shop was closed, and spent most of a week on the claim. She also began to wake at night when a car passed the shop, and asked her nephew to come with her when she locked up. None of this appears in the police statistics, which record a single break and enter, cleared by charge.
Who the numbers miss
Brooks warns that even surveys miss some victims. People without a fixed address are hard to sample, as are people living in shelters, hospitals, prisons, group homes and long-term care facilities, where some of the most vulnerable people live. People who do not speak the survey's languages, or who distrust government callers, may refuse to take part. Children are covered only from age 12 in the NCVS, and very young children not at all. Some people do not recognize what happened to them as a crime, especially when the offender is a partner, family member or caregiver. For these groups, researchers rely on special surveys, service records from shelters, hospitals and child protection agencies, and studies done in partnership with community organizations. An officer who assumes that the official figures describe everyone may underestimate the harm in the very communities that need the most help.
Estimating the dark figure locally
National surveys cannot describe Port Ardent directly, but they can help analysts estimate how much crime the city's police statistics might be missing. If police recorded a certain number of break and enters, and surveys suggest that about half of break and enters are reported, the true number could be roughly twice the recorded number. Linh Tran uses this idea in the program below. She is careful to call the results rough estimates: the national reporting rates may not fit Port Ardent, and some reported incidents are never recorded.
# Rough estimate of total incidents in Port Ardent from recorded counts and survey reporting rates
recorded = {"break and enter": 588, "robbery": 61, "assault": 1240, "theft from vehicle": 702}
# assumed share of incidents that victims report (illustrative, based on national surveys)
report_rate = {"break and enter": 0.50, "robbery": 0.48, "assault": 0.40, "theft from vehicle": 0.30}
population = 98000
total_est = 0
for crime, n in recorded.items():
    est = round(n / report_rate[crime])
    total_est += est
    print(f"{crime:19} recorded {n:5}  estimated {est:5}  unreported {est - n:5}")
print("recorded total:", sum(recorded.values()), "estimated total:", total_est)
print("estimated incidents per 1,000 residents:", round(total_est / population * 1000, 1))break and enter recorded 588 estimated 1176 unreported 588 robbery recorded 61 estimated 127 unreported 66 assault recorded 1240 estimated 3100 unreported 1860 theft from vehicle recorded 702 estimated 2340 unreported 1638 recorded total: 2591 estimated total: 6743 estimated incidents per 1,000 residents: 68.8
The estimate suggests that thousands of incidents in a year never reached the police. Desjardins points out what that means at the front counter: for every victim who calls, there may be one or two more who decided not to. The ones who do call are, in a sense, giving the police a chance to prove that calling was worth it.
Reading victimization statistics carefully
Brooks gives the class four habits for reading victimization statistics. First, check what is being counted: incidents, victims or households, and whether the figure is a rate or a count. A rise in the number of incidents can simply reflect population growth. Second, check the period and the population: a survey of people 15 and older says nothing about younger children. Third, look at the margin of error, especially for small groups and rare crimes; a change from one survey to the next may not be real. Fourth, remember that a rise in police-reported crime can mean more crime, more reporting, or changes in how police record incidents. A campaign that encourages victims of intimate partner violence to come forward should increase police-reported numbers, and that would be a success, not a failure.
Priya Sandhu, who spent five years as a bank fraud analyst, adds a fifth habit from her own work: some crimes are badly measured by both methods. Fraud victims often report to their bank, not the police, and many never realize they were defrauded at all. The FBI's Internet Crime Complaint Center receives hundreds of thousands of complaints a year, but researchers believe most online fraud is never reported to anyone. Grace Whitford almost did not report hers. She told Brooks later that she felt foolish, and that her first thought was that she should not have to tell anyone.
Worked problem
Explaining a rise in reported crime
Port Ardent's police-reported sexual assaults rose by about a third the year after the service and the hospital launched a joint campaign telling survivors they could report in several ways, including online and through the hospital's treatment program. A city councillor says the city is becoming more dangerous. How should the service explain the figure?
Show solution
- Check whether the rise reflects more crime or more reporting: survey data show that only a small share of sexual assaults are reported, so even a small increase in reporting produces a large rise in recorded numbers.
- Look for supporting evidence: were more of the reports about older incidents, which suggests people were coming forward about past events? Did the hospital's program see the same pattern?
- Consider recording changes: did the service change how it classifies or records these incidents?
- Explain the goal: the campaign was meant to make reporting easier, so an increase in reports is a sign that more victims are getting access to help.
- Stay humble about the data: a single year's change is not proof, and the service should keep watching the trend and survivors' feedback.
Answer: The rise most likely reflects increased reporting after the campaign, which is consistent with its goals, though the service should check for recording changes and keep monitoring.
Common mistakes
MistakePolice statistics count all crime.
InsteadThey count only incidents reported to and recorded by police; surveys show most crime goes unreported.
MistakeA rise in reported crime always means crime is rising.
InsteadIt can reflect more reporting or recording changes, which may be a sign of success.
MistakeVictims should always be pressured to report.
InsteadVictims are entitled to services without reporting; the goal is to make reporting safe and worthwhile.
MistakeThe NCVS can describe crime in Port Ardent.
InsteadNational surveys have samples too small for a single city; they can only inform rough local estimates.
Summary and key terms
- Police-reported data come from the FBI's NIBRS; victimization data come from the NCVS.
- Victimization surveys capture unreported crime but cannot count homicide or business victims and rely on recall.
- In 2023 almost half of violent victimizations and about 30 in 100 property victimizations were reported to police.
- Common reasons for not reporting include the crime seeming minor, belief that police cannot help, fear of reprisal and shame.
- Reporting opens access to investigation and some forms of help, but victims are entitled to services without reporting.
- Read statistics carefully: what is counted, for whom, with what margin of error, and whether reporting has changed.
- Dark figure
- The amount of crime that is never reported to or recorded by police.
- Victimization survey
- A survey that asks a random sample of people whether they have been victims of crime.
- Reporting rate
- The share of incidents that victims or others report to police.
- Rate per 1,000
- The number of incidents for every 1,000 people or households in the population.
- Margin of error
- The range within which a survey estimate is likely to fall because it is based on a sample.
- NIBRS
- The FBI's incident-based system for police-reported crime.
Practice problems
Work each problem on paper first, then reveal the answer to check.
Name two crimes that victimization surveys cannot count.
Show answer
Homicide and crimes against businesses.
What is the most common reason victims give for not reporting?
Show answer
That the crime seemed too minor or nobody was hurt.
In the code example, how many break and enters does Linh estimate occurred?
Show answer
1,176, compared with 588 recorded.
Why might a campaign to encourage reporting increase police-reported crime?
Show answer
Because more victims report incidents that would otherwise have stayed in the dark figure.
Lesson quiz · 5 questions
Score 60% or more to complete this lesson.
Create a free account to save your progress, take quizzes and earn a certificate.