
ITIL-130 · Lesson 7 of 12 · 32 min
Deliver and support
Most of the time, most people experience a service through the deliver and support activity. It is where services are actually provided day after day: systems run, requests are fulfilled, questions are answered and incidents are resolved. If design and transition and obtain/build create the service, deliver and support keeps it working for consumers. This lesson examines the purpose, inputs and outputs of deliver and support, how it handles different types of work, how it measures performance and how it feeds improvement back into the system.
The purpose of deliver and support
In plain terms, deliver and support ensures that services are delivered and supported according to agreed specifications and stakeholder expectations. Agreed specifications include service level agreements, operational level agreements and contracts. Stakeholder expectations go further: users expect services that are easy to use and quick to restore even where no formal agreement says so. Deliver and support must meet both.
The activity covers routine service operation (running systems, monitoring, backups, capacity management), user support (answering questions, fulfilling requests, resolving incidents) and the collection of information about how services are performing. It draws on practices such as service desk, incident management, service request management, monitoring and event management, problem management, and infrastructure and platform management.
Inputs and outputs
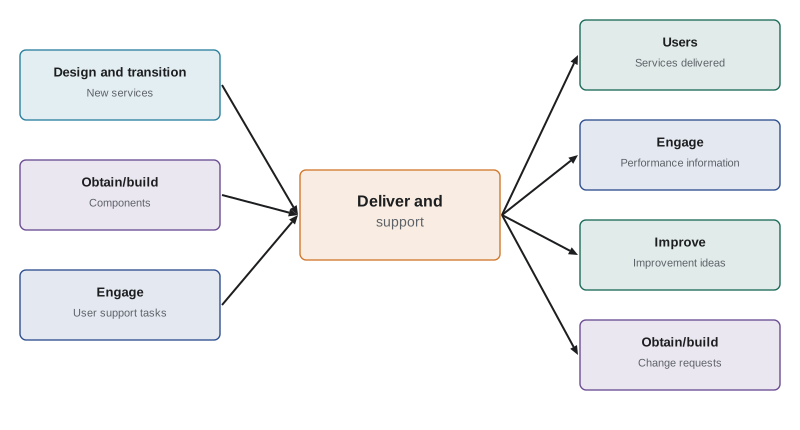
Deliver and support receives new and changed products and services from design and transition, service components from obtain/build, user support tasks from engage, improvement initiatives and plans from improve, and knowledge and information about new and changed services and components. Its outputs include services delivered to customers and users, information on the completion of user support tasks for engage, product and service performance information for engage and improve, improvement opportunities for improve, contract and agreement requirements for engage, and change requests for obtain/build.
Types of work in deliver and support
Deliver and support handles several types of work, each with different characteristics. Standard requests are predictable and can often be automated. Incidents are unplanned and urgent. Operational tasks are scheduled and routine. Problems require investigation over time. Recognizing which type of work is which helps the organization route it correctly and set suitable expectations.
| Type of work | Characteristics | Typical practice | Example |
|---|---|---|---|
| Service request | Predictable, pre-defined, often low risk | Service request management | Reset a password; install standard software |
| Incident | Unplanned interruption or reduction in quality | Incident management | Email unavailable for a department |
| Operational task | Scheduled, routine, repeatable | Infrastructure and platform management | Nightly backups; patch scans |
| Problem investigation | Finding and removing causes of incidents | Problem management | Why does the batch job fail every Monday? |
| Event | A detected change of state, possibly significant | Monitoring and event management | Disk usage passes 85 % |
Restoring service quickly
When an incident occurs, the priority is to restore service, not to find the root cause immediately. Root cause analysis belongs to problem management and can happen later. Deliver and support measures how quickly service is restored using metrics such as mean time to restore service (MTTR) and the share of incidents resolved within target times.
Worked problem
Calculating availability and the effect of faster restoration
A service is meant to be available 24 hours a day. Over a 30-day month, it suffers 6 incidents with an average restoration time of 90 minutes. What is its availability? If better monitoring and runbooks cut average restoration to 30 minutes, what does availability become?
Show solution
- Total minutes in the month: 30 × 24 × 60 = 43,200.
- Current downtime: 6 × 90 = 540 minutes. Availability = (43,200 − 540) ÷ 43,200 ≈ 98.75 %.
- Improved downtime: 6 × 30 = 180 minutes. Availability = (43,200 − 180) ÷ 43,200 ≈ 99.58 %.
- The number of incidents did not change; faster restoration alone added over 0.8 percentage points.
Answer: Availability rises from about 98.75 % to about 99.58 % by cutting restoration time from 90 to 30 minutes.
Shift-left and self-service
Many organizations aim to resolve work as early and as close to the user as possible. This approach is often called shift-left. Instead of every question going to specialist teams, the service desk resolves more on first contact, and users resolve more themselves through self-service and knowledge articles. Shift-left reduces cost and wait times, provided the knowledge and tools are good enough.
Worked problem
Cost of resolution by support level
A provider estimates the cost of resolving a contact as $3 through self-service, $18 at the service desk, $65 at second-line support and $160 at third-line specialists. Currently, of 10,000 monthly contacts, 10 % are self-served, 50 % resolved at the desk, 30 % at second line and 10 % at third line. If shift-left changes the split to 30 %, 50 %, 15 % and 5 %, what is the monthly saving?
Show solution
- Current: 1,000 × $3 + 5,000 × $18 + 3,000 × $65 + 1,000 × $160 = $3,000 + $90,000 + $195,000 + $160,000 = $448,000.
- Improved: 3,000 × $3 + 5,000 × $18 + 1,500 × $65 + 500 × $160 = $9,000 + $90,000 + $97,500 + $80,000 = $276,500.
- Saving: $448,000 − $276,500 = $171,500 a month.
Answer: Shift-left saves about $171,500 a month, while users get answers faster.
Little's Law in support queues
Deliver and support teams manage queues: tickets waiting to be worked on. Little's Law, from queueing theory, links three quantities in a stable system: the average number of items in the system (L) equals the average arrival rate (λ) multiplied by the average time each item spends in the system (W).
Little's Law is useful because it shows that, for a given arrival rate, the only way to reduce waiting time is to reduce the number of items waiting, and vice versa. A team with a large backlog will have long waits unless it increases throughput or reduces arrivals.
Worked problem
Using Little's Law on a request queue
A team receives an average of 40 requests per working day. On average, 200 requests are open at any time. What is the average time a request spends in the system? If the team reduces the open backlog to 80 without changing arrivals, what happens to the average time?
Show solution
- Rearrange Little's Law: W = L ÷ λ.
- Current: W = 200 ÷ 40 = 5 working days.
- Improved: W = 80 ÷ 40 = 2 working days.
- To keep the backlog at 80, the team must complete requests as fast as they arrive, about 40 per day, after clearing the excess.
Answer: Average time falls from 5 to 2 working days. Reducing work in the system directly reduces waiting time.
Measuring deliver and support
Deliver and support produces much of the performance information the organization uses. Useful measures combine outputs (volumes, response times) with outcomes (user satisfaction, business impact avoided). ITIL-110 warned about watermelon reporting, where service level agreements look green while users are unhappy. Good measurement in deliver and support includes the user's perspective as well as the provider's.
| Measure | What it shows | Caution |
|---|---|---|
| Mean time to restore service | Speed of restoration after incidents | Averages can hide long outliers |
| First-contact resolution rate | Share of contacts resolved without escalation | Can be gamed by closing tickets prematurely |
| Request fulfillment time | Speed of standard requests | Should be measured from the user's request, not from approval |
| Availability | Share of agreed time the service was usable | Must be measured from the user's viewpoint |
| User satisfaction or effort score | How users experience support | Response rates may be low and biased |
Feeding improvement
Deliver and support is the activity closest to how services actually behave, so it is the richest source of improvement opportunities. Recurring incidents, frequent requests that could be automated, gaps in knowledge articles and supplier performance problems all surface here. A mature organization makes it easy for support staff to raise improvement ideas and makes sure those ideas reach the improve activity and the continual improvement register.
Worked problem
Finding automation candidates in request data
Request data for a month shows: 900 password resets (5 minutes each), 300 software installs (20 minutes each), 120 new user accounts (45 minutes each) and 60 printer issues (15 minutes each). Which request type consumes the most staff time, and which might be easiest to automate?
Show solution
- Password resets: 900 × 5 = 4,500 minutes (75 hours).
- Software installs: 300 × 20 = 6,000 minutes (100 hours).
- New user accounts: 120 × 45 = 5,400 minutes (90 hours).
- Printer issues: 60 × 15 = 900 minutes (15 hours).
- Software installs use the most time; password resets are usually the easiest to automate with self-service.
Answer: Software installs consume the most time (100 hours) and are a strong automation candidate through a self-service catalog; password resets (75 hours) are typically the quickest win.
Deliver and support and the other activities
Deliver and support depends on every other activity. It needs well-designed, well-tested services from design and transition; reliable components from obtain/build; clear expectations from engage; priorities and capacity from plan; and improvements from improve. When deliver and support struggles, the cause often lies upstream: a poorly designed service, a missing runbook, an unreliable supplier. The value chain view encourages looking for those causes rather than blaming the support team.
US organizations that support services handling personal information face state breach notification laws, which every state has enacted, and sector rules such as HIPAA for health data. Deliver and support teams need procedures that connect incident handling to these obligations.
Deliver and support in ITIL (Version 5)
The lifecycle activities reported for Version 5 split this territory into operate, deliver and support. Operate covers keeping systems and services running; deliver covers providing the service to consumers; support covers helping users and restoring service. Published course outlines also mention concepts such as reliability and observability under the value chain. The skills in this lesson apply in either edition.
Knowledge as a support asset
Much of the performance of deliver and support depends on knowledge: articles that explain how to fix common problems, runbooks for operational tasks and records of past incidents. Knowledge that is accurate, findable and up to date lets the service desk resolve more on first contact and lets users help themselves. Knowledge that is outdated or scattered across personal notes does the opposite. Many teams adopt a simple rule: whenever an agent resolves something not covered by an existing article, they create or update one before closing the ticket.
Worked problem
Value of a knowledge article
A common printer error generates 120 contacts a month. Without an article, each contact takes 15 minutes and 40 % are escalated, adding 30 minutes of specialist time. With an article, handling falls to 6 minutes and escalations to 5 %. How much time is saved per month?
Show solution
- Before: 120 × 15 = 1,800 minutes, plus 48 escalations × 30 = 1,440 minutes; total 3,240 minutes.
- After: 120 × 6 = 720 minutes, plus 6 escalations × 30 = 180 minutes; total 900 minutes.
- Saving: 3,240 − 900 = 2,340 minutes, or 39 hours a month.
Answer: One good article saves about 39 hours a month.
Common mistakes
MistakeSearching for root causes before restoring service.
InsteadRestore service first; investigate causes through problem management afterwards.
MistakeRouting every contact to specialists.
InsteadShift work left with good knowledge, self-service and first-contact resolution.
MistakeReporting only provider-side metrics.
InsteadInclude user experience and outcomes to avoid watermelon reporting.
MistakeTrying to cut waiting time without reducing work in the system.
InsteadUse Little's Law: reduce the backlog or increase throughput to shorten waits.
MistakeBlaming support for problems that originate upstream.
InsteadTrace issues to design, components or suppliers through the value chain.
Summary and key terms
- Deliver and support ensures services are delivered and supported to agreed specifications and stakeholder expectations.
- It handles service requests, incidents, operational tasks, problems and events.
- Restoring service quickly is the priority during incidents; causes are investigated later.
- Shift-left and self-service reduce cost and waiting time when knowledge is good.
- Little's Law (L = λ × W) links backlog, arrival rate and waiting time.
- Good measurement combines provider metrics with user experience.
- Deliver and support is the richest source of improvement opportunities for the rest of the chain.
- Deliver and support
- The activity ensuring services are delivered and supported to agreed specifications and expectations.
- Service request
- A user request for a predefined, routine action or item.
- Incident
- An unplanned interruption to a service or reduction in its quality.
- Mean time to restore service (MTTR)
- The average time taken to restore service after an incident.
- Availability
- The share of agreed time during which a service is usable.
- Shift-left
- Moving resolution closer to the user, through self-service and first-contact resolution.
- First-contact resolution
- Resolving a contact without escalation or follow-up.
- Little's Law
- In a stable system, average items in the system equal arrival rate times average time in the system.
- Backlog
- Work items waiting to be completed.
- Watermelon reporting
- Metrics that look green while users are dissatisfied.
Practice problems
Work each problem on paper first, then reveal the answer to check.
State the purpose of deliver and support.
Show answer
To ensure services are delivered and supported according to agreed specifications and stakeholder expectations.
Name three types of work handled by deliver and support.
Show answer
Service requests, incidents and operational tasks (also problems and events).
A month has 43,200 minutes and a service is down for 216. What is its availability?
Show answer
(43,200 − 216) ÷ 43,200 = 99.5 %.
Arrivals average 25 per day and 150 items are open. What is the average time in the system?
Show answer
150 ÷ 25 = 6 days.
What is shift-left?
Show answer
Resolving work closer to the user, through self-service and the service desk.
Why restore service before finding root cause?
Show answer
Restoring service limits impact on users; root cause analysis can follow through problem management.
Which activity receives change requests from deliver and support?
Show answer
Obtain/build.
Give one caution about first-contact resolution as a metric.
Show answer
It can be gamed by closing tickets prematurely.
Why is deliver and support a rich source of improvement ideas?
Show answer
It is closest to how services actually behave, so recurring issues surface there.
Which Version 5 lifecycle activities correspond to deliver and support?
Show answer
Operate, deliver and support.
Lesson quiz · 5 questions
Score 60% or more to complete this lesson.
Create a free account to save your progress, take quizzes and earn a certificate.