
ITIL-130 · Lesson 2 of 12 · 30 min
Opportunity, demand and value
Every organization faces more possible work than it can do. Users ask for new features, managers propose projects, suppliers pitch new technologies and incidents expose things that should be fixed. The service value system begins with this raw material: opportunity and demand. What happens next decides whether the organization delivers value or simply stays busy. This lesson looks closely at the inputs to the system, how they are captured, filtered and prioritized, and how the organization knows whether the value it intended has actually been realized.
Two kinds of input
Lesson 1 defined the two inputs. Demand is a need or desire for products and services from internal or external consumers. Opportunity is an option or possibility to add value for stakeholders or improve the organization. The distinction matters because the two arrive differently and are handled differently.
Demand usually arrives through known channels: a service request, a call to the service desk, a sales enquiry, a project proposal from a business unit. It is attached to a stakeholder who expects a response. Opportunity often arrives without an owner. It might be noticed by an engineer reading release notes, an analyst reviewing incident trends or a manager talking with peers at a conference. Unless the organization has a way to capture opportunities, many are simply lost.
| Input | Typical sources | Typical risk if unmanaged |
|---|---|---|
| Demand from users | Service desk, portals, chat, email | Queues grow; urgent requests drown important ones |
| Demand from customers or business units | Account reviews, project proposals, contracts | Loudest voice wins rather than greatest value |
| Opportunity from technology | Vendor roadmaps, cloud services, engineers' ideas | Shiny technology adopted without a value case |
| Opportunity from data | Incident and problem trends, usage analytics | Recurring failures never fixed |
| Opportunity from the environment | Regulation, competitors, social change | Organization reacts late and expensively |
Demand is not uniform
Demand varies in volume, timing and predictability. Some demand is steady: password resets arrive at a fairly constant rate every working day. Some is seasonal: a tax-preparation firm sees enormous demand in the spring, a university at the start of each term, a retailer before major holidays. Some is driven by events: a new software release produces a wave of how-to questions; an outage produces a flood of incident reports.
Understanding these patterns lets an organization plan capacity. ITIL calls this demand management in older material and capacity and performance management as a practice; the details belong to ITIL-141. At the system level, the point is that the plan and engage activities must understand demand patterns, otherwise teams will be idle at some times and overwhelmed at others.
Worked problem
Shaping demand with self-service
A service desk receives 4,000 contacts a month. Analysis shows 1,200 are password resets, each taking an agent 6 minutes. A self-service reset tool is expected to handle 80 % of them. How many agent hours a month are freed, and what share of total contacts disappears?
Show solution
- Resets moved to self-service: 1,200 × 0.80 = 960.
- Agent time freed: 960 × 6 minutes = 5,760 minutes = 96 hours a month.
- Share of total contacts removed: 960 ÷ 4,000 = 24 %.
- The freed capacity can be redirected to opportunities, such as fixing the causes of recurring incidents.
Answer: About 96 agent hours a month are freed, and contacts fall by 24 %. Shaping demand creates capacity for higher-value work.
Capturing opportunity
Because opportunities lack a natural owner, organizations need deliberate ways to capture them. Common approaches include an idea portal open to all staff, a regular review of problem records and incident trends, a technology radar that tracks emerging tools, and structured conversations with customers about their future plans. The continual improvement register described in ITIL-120 can hold improvement opportunities alongside other ideas.
Capturing an opportunity is not the same as committing to it. A good capture process asks for a short description of the expected value, the stakeholders affected and a rough size. That information lets the plan activity and governance compare opportunities fairly with demand, rather than favoring whichever arrives with the most enthusiasm.
Filtering and prioritizing
Since capacity is limited, the system must decide which demand to fulfill, in what order, and which opportunities to pursue. ITIL leaves the method to the organization, but the decisions should be guided by value and made transparently. Typical filters include alignment with strategy, legal or regulatory obligation, risk reduction, cost, and the size of the benefit.
One widely used technique is weighted shortest job first (WSJF), introduced in ITIL-120. It divides the cost of delay of an item by its size, so that small, high-value items rise to the top. Cost of delay combines the value to users, the time sensitivity of that value, and any risk reduction or opportunity enablement.
Worked problem
Prioritizing mixed demand and opportunity with WSJF
A provider has capacity for one item this month. Item A (demand): a business unit wants a new dashboard; cost of delay scored 8, size 4. Item B (opportunity): automating a recurring incident fix; cost of delay 15, size 5. Item C (demand): a regulatory report required by year end; cost of delay 21, size 7. Rank the items by WSJF.
Show solution
- A: 8 ÷ 4 = 2.0.
- B: 15 ÷ 5 = 3.0.
- C: 21 ÷ 7 = 3.0.
- B and C tie at 3.0. A sensible tie-breaker is time sensitivity: C has a fixed regulatory deadline, so schedule C first unless B can be done in parallel.
- A ranks last at 2.0, even though it arrived through a formal request.
Answer: C and B tie at 3.0 and outrank A at 2.0. The regulatory deadline makes C the likely first choice. An opportunity (B) can legitimately outrank formal demand.
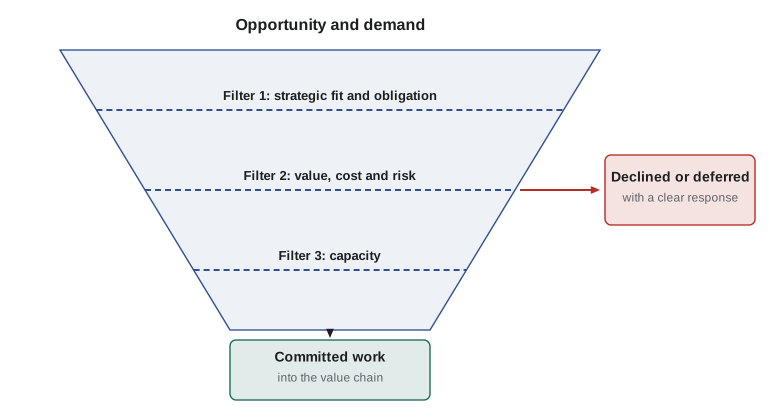
Saying no, or not yet
Filtering means some demand will be declined or deferred. How that is handled affects the relationship with the consumer as much as the decision itself. A request that disappears into a backlog without a response damages trust. A clear explanation (what was decided, why, and what alternatives exist) preserves it. The engage activity, covered in lesson 5, is responsible for this communication.
Some demand cannot be refused. Legal and regulatory obligations, security vulnerabilities and safety issues must be addressed regardless of their WSJF score. Many organizations handle these as a separate class of work with reserved capacity, so that mandatory items do not crowd out everything else unpredictably.
Worked problem
Reserving capacity for mandatory work
A team completes about 50 items a quarter. Over the past four quarters, mandatory items (security patches, audit findings and regulatory changes) numbered 9, 12, 8 and 11. How much capacity should the team reserve for mandatory work, and how much remains for discretionary demand and opportunities?
Show solution
- Average mandatory items: (9 + 12 + 8 + 11) ÷ 4 = 40 ÷ 4 = 10 per quarter.
- Share of capacity: 10 ÷ 50 = 20 %.
- Adding a buffer for variation (the range was 8 to 12), the team might reserve 12 items, about 24 %.
- Remaining capacity: 50 − 12 = 38 items a quarter for discretionary work.
Answer: Reserve about 24 % (12 items) for mandatory work, leaving 38 items for discretionary demand and opportunities.
From value intended to value realized
When an item enters the system, someone usually has an idea of the value it should create: faster processing, fewer errors, new revenue, lower cost or reduced risk. That is value intended. Value is realized only when consumers actually use the product or service and achieve the outcome. The gap between the two can be large. A new self-service portal that nobody uses realizes no value, however well it was built.
For this reason, the system should track items beyond delivery. Useful questions include: Is the service being used? By whom? Did the expected outcome improve? Did new costs or risks appear? These questions feed back into the plan and improve activities and into governance.
| Stage | Question to ask | Example measure |
|---|---|---|
| Captured | What value do we expect, for whom? | Stated benefit: 30 % faster onboarding |
| Committed | Is this the best use of our capacity? | WSJF score, strategic fit |
| Delivered | Does it work as specified? | Acceptance tests passed |
| Adopted | Are consumers using it? | Active users, usage frequency |
| Realized | Did the outcome improve? | Onboarding time fell from 10 to 7 days |
Worked problem
Comparing intended and realized value
A self-service knowledge base was approved on the expectation that it would deflect 1,000 service desk contacts a month, saving $8 per contact. Six months after launch, analytics show 2,500 article views a month, of which about 20 % end without the user contacting the desk. What value is being realized compared with what was intended?
Show solution
- Intended saving: 1,000 × $8 = $8,000 a month.
- Realized deflections: 2,500 × 0.20 = 500 contacts a month.
- Realized saving: 500 × $8 = $4,000 a month, half the intended value.
- The gap is input for improvement: perhaps articles are hard to find or do not solve common problems.
Answer: About $4,000 a month is realized against $8,000 intended. The gap should trigger investigation rather than be ignored.
Value for whom?
Different stakeholders value different things, and a single item can create value for some while imposing costs on others. A tighter security control may create value for the organization by reducing risk while imposing friction on users. A new feature may delight one customer group while confusing another. ITIL-110 introduced the idea of balancing outcomes, costs and risks for each stakeholder. At the system level, governance must decide how to weigh these interests, and the engage activity must make sure each stakeholder's view is heard.
Public-sector organizations face particular versions of this question. In the United States, a federal service must weigh the value to the individual customer against obligations such as accessibility under Section 508 and privacy under the Privacy Act of 1974. A change that is cheaper for the agency but less accessible may not be acceptable at all.
Inputs, outputs and the rest of the course
The remaining lessons follow opportunity and demand into the value chain. Lessons 3 to 7 explain the six activities that process them. Lessons 8 and 9 show how value streams combine those activities for specific kinds of demand. Lessons 10 and 11 add the holistic view of the four dimensions and the role of partners and suppliers. Lesson 12 returns to governance and improvement, which keep the whole system pointed at value.
Common mistakes
MistakeTreating every request in the queue as equally important.
InsteadFilter and prioritize demand and opportunity by value, urgency and obligation.
MistakeLetting opportunities depend on someone remembering them.
InsteadCapture opportunities deliberately, with a short value statement and rough size.
MistakeLeaving declined requests without a response.
InsteadExplain decisions and alternatives through the engage activity to preserve trust.
MistakeDeclaring success when a product is delivered.
InsteadTrack adoption and outcomes to confirm that value was realized.
MistakeLetting mandatory work crowd out everything else unpredictably.
InsteadReserve capacity for mandatory work based on its historical level.
Summary and key terms
- Demand is a need or request from consumers; opportunity is a possibility to add value that may not yet be requested.
- Demand varies in volume and timing, so the system must understand its patterns to plan capacity.
- Opportunities lack natural owners and must be captured deliberately.
- Filtering and prioritizing, for example with WSJF, directs limited capacity to the most valuable work.
- Declined or deferred items deserve a clear explanation; mandatory items need reserved capacity.
- Value intended becomes value realized only when consumers use what is delivered and outcomes improve.
- Different stakeholders value different things, so governance and engagement must balance their interests.
- Demand pattern
- The way demand varies over time, such as steady, seasonal or event-driven.
- Demand shaping
- Influencing demand, for example through self-service or pricing, to match capacity.
- Cost of delay
- The value lost by delaying an item, combining user value, time sensitivity and risk reduction.
- WSJF
- Weighted shortest job first: cost of delay divided by job size, used to prioritize work.
- Value intended
- The benefit expected when an item is approved.
- Value realized
- The benefit actually achieved when consumers use the product or service.
- Deflection
- A contact avoided because the user solved the issue through self-service.
- Mandatory work
- Work required by law, regulation, security or safety regardless of priority scores.
- Idea portal
- A channel for staff or customers to submit improvement opportunities.
- Backlog
- An ordered list of work items waiting to be done.
Practice problems
Work each problem on paper first, then reveal the answer to check.
Distinguish demand from opportunity with one example of each.
Show answer
Demand: a business unit requests a new report. Opportunity: an engineer notices a cloud service that could cut costs.
An item has cost of delay 18 and size 6. What is its WSJF score?
Show answer
18 ÷ 6 = 3.0.
Why should declined requests receive a response?
Show answer
Silence damages trust; an explanation and alternatives preserve the relationship.
A team averages 6 mandatory items in 40 per quarter. What share of capacity is that?
Show answer
6 ÷ 40 = 15 %.
What is the difference between value intended and value realized?
Show answer
Intended is the expected benefit at approval; realized is the benefit actually achieved through use.
Name two sources of opportunity.
Show answer
Incident and problem trends; new technologies; regulation; competitor moves; staff ideas.
Self-service removes 300 contacts a month at 5 minutes each. How many hours are freed?
Show answer
1,500 minutes = 25 hours a month.
Which value chain activity communicates decisions to consumers?
Show answer
Engage.
Give one measure of adoption.
Show answer
Active users or usage frequency.
Why can an opportunity outrank formal demand?
Show answer
Prioritization should follow value, not the channel through which an item arrived.
Lesson quiz · 5 questions
Score 60% or more to complete this lesson.
Create a free account to save your progress, take quizzes and earn a certificate.