
HSE-407 · Lesson 5 of 12 · 20 min
Designing indicators that work
By the end of the third month, the working group had a long list of possible indicators. Nina counted 47. Some came from the sites, some from Elena's reading, some from the food safety system Aisha Rahman ran, and a few from a consultant's report that Richard Lam had been sent. Margaret Doyle's response, when Elena showed her the list, was short: 'Nobody can manage 47 things. Which ten would tell us whether people could be killed here?'
This lesson covers how Harrowgate Foods Inc. narrowed the list, how it wrote each indicator down so that it meant the same thing everywhere, and how it set targets, thresholds and responses. It ends with a first attempt to test whether the chosen indicators actually move with outcomes.
Start from the risks, not the data
The easiest way to build an indicator set is to look at what data already exist and turn them into charts. The result is usually a set of measures that reflect what has always been recorded rather than what matters. The working group went the other way. It started from the hazard register built in HSE-404 and the nine serious hazards identified in Lesson 4, and asked for each one: what are the critical controls, how would we know if they were failing, and what data would show it?
Only after answering those questions did Nina look for the data. In some cases they existed, such as the lockout permit records. In others, such as forklift separation checks, the data had to be created by starting a new field verification. In a few cases, such as fatigue on long sanitation shifts, the group decided that the best indicator was a simple one from the scheduling system: the number of shifts longer than twelve hours.
The indicator specification
Every indicator that made the final list was written up on a one-page specification. The figure shows the template, filled in for one of the lockout indicators.
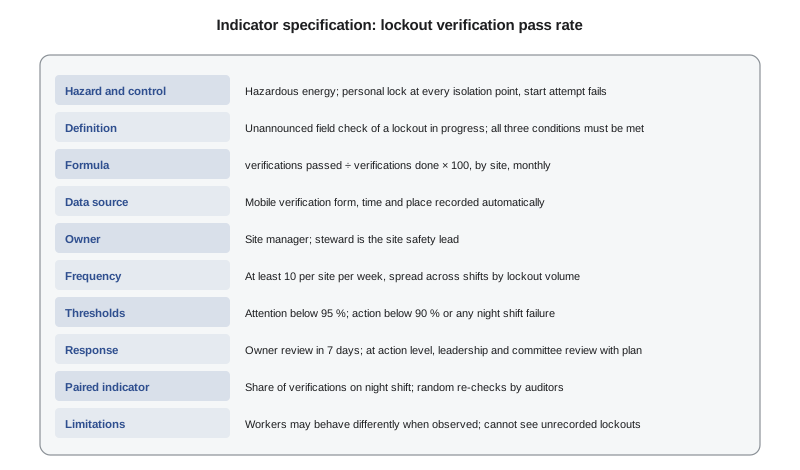
- Name and purpose: what the indicator is called and which hazard or control it relates to.
- Definition: exactly what is counted, including what is included and excluded.
- Formula: how the number is calculated, with the numerator, denominator and any base.
- Data source: where the data come from and who records them.
- Owner: the person responsible for the indicator's accuracy and for acting on it.
- Frequency: how often the data are collected and how often the indicator is reported, and to whom.
- Target and threshold: the level aimed for, and the level that triggers a response.
- Response: what happens when the threshold is crossed, and who does it.
- Paired indicator: the measure that would show if this one were being gamed.
- Known limitations: what the indicator cannot show.
Writing the specification turned out to be the most useful part of the whole exercise. Several indicators that looked obvious fell apart when people tried to define them. 'Inspections completed', for example, raised questions nobody had asked: does an inspection count if half the checklist was skipped? If it was done a week late? If the inspector found nothing in an area that a second inspector found full of hazards?
Operational definitions
An operational definition describes a measure precisely enough that two people would count the same thing. The working group's definition for a completed lockout verification, for example, read: 'A supervisor or trained verifier observes a lockout in progress, checks that each worker has applied a personal lock at every isolation point listed in the machine's procedure, and observes a start attempt that fails. The verification passes only if all three conditions are met. Verifications are unannounced and spread across all shifts in proportion to the number of lockouts on each shift.'
The last sentence mattered as much as the first. Without it, verifications would cluster on day shift, when supervisors were present, and the night sanitation shift, where the spiral conveyor injury happened, would be under-sampled. Lesson 8 returns to this question of sampling.
Fewer, better indicators
The group cut the list from 47 to 14, grouped into three tiers. The board would see six of them, site leaders all fourteen, and supervisors the ones that related to their own areas. The criteria for keeping an indicator were the qualities listed in Lesson 1, and the group scored each candidate against them. Indicators were dropped if they could not be defined clearly, if the data could not be collected reliably, if no one could act on them, or if they duplicated another indicator.
The final set included three lagging indicators (the recordable rate, the DART rate and serious injuries), two SIF indicators (SIF-potential events per 200,000 hours and the share of them investigated within ten days), four critical control indicators (lockout, forklift separation, machine guarding and ammonia), two response indicators (corrective actions closed on time and high-risk inspection findings open more than 30 days), and three culture and reporting indicators (near misses per 100 workers, and two pulse survey questions).
Targets, thresholds and responses
A target says where the company wants to be. A threshold says when someone must act. The working group found thresholds more useful than targets, for two reasons. A threshold comes with a defined response, so it turns measurement into action. And thresholds are harder to game than targets, because the response is a review, not a reward or punishment.
For each indicator, the specification set two thresholds: an attention level, which triggered a review by the indicator's owner within a week, and an action level, which triggered a review by the site leadership team and the safety committee and a written action plan. The colors on the new dashboards, covered in Lesson 11, came directly from these thresholds, so that 'amber' always meant the attention level had been crossed and 'red' the action level.
Targets were set only for leading indicators that managers could directly influence, such as corrective action closure, and only after a baseline period. Elena warned that even these could be gamed. A target for closing corrective actions on time can be met by closing actions before they are really done, or by setting generous due dates. The paired indicator for closure on time was therefore the share of closed actions that passed an effectiveness check, done by someone other than the action owner.
Worked problem
Writing the specification for near-miss reporting
Show solution
- Name and purpose: near misses reported per 100 workers per year, as a measure of reporting health and an early source of SIF-potential events.
- Definition: an unplanned event that did not cause injury or damage but could have, reported through any channel, including verbal reports written up by a supervisor. Hazard reports with no event are counted separately.
- Formula: \(N_{\text{NM}} \times 100 / W\), where \(W\) is the average number of workers including supervised agency workers, reported as a rolling twelve-month figure.
- Threshold and response: a fall of more than a third against the site's own previous twelve months, or a site below 25 per 100 workers, triggers a conversation with the safety committee about barriers to reporting.
- Paired indicator and limitations: the share of near misses with a recorded action, because a high count with no action shows reporting without response. The indicator cannot show events that were never reported.
Answer: The specification made a vague idea measurable, built in a check against empty reporting, and set a response aimed at fixing barriers rather than punishing low numbers.
Testing whether indicators move with outcomes
If an indicator really leads outcomes, improvements in it should be followed by improvements in harm. Nina wanted to test this, but she knew the company had little data on the new indicators yet. She built a simulation instead, with 24 months of data in which she knew the true relationship: injury risk in each month fell as the previous month's critical control pass rate rose, while inspection completion had no effect at all. She then checked whether a simple correlation would detect the relationship.
# Do leading indicators move with outcomes? 24 months of seeded data
import math, random, statistics
random.seed(4075)

def poisson(lam):
    # Knuth's method: count uniform draws until their product falls below e^-lam
    L, k, p = math.exp(-lam), 0, 1.0
    while True:
        p *= random.random()
        if p < L:
            return k
        k += 1

months = 24
hours = [random.randint(95_000, 108_000) for _ in range(months)]
inspect = [random.uniform(85, 100) for _ in range(months)]      # % of planned inspections done
ccv = [min(99.0, 80 + 0.6 * m + random.gauss(0, 3)) for m in range(months)]  # % critical control checks passed
recs = []
for m in range(months):
    prev = ccv[m - 1] if m else ccv[0]
    lam = hours[m] / 200_000 * (5.6 - 0.12 * (prev - 85))   # risk falls as last month's controls improve
    recs.append(poisson(lam))
rate = [r * 200_000 / h for r, h in zip(recs, hours)]

def r_next(x, y):
    # correlate this month's indicator with next month's rate
    return statistics.correlation(x[:-1], y[1:])

print(f"total recordables: {sum(recs)} in {sum(hours):,} hours")
print(f"inspections done vs next month's rate:   r = {r_next(inspect, rate):+.2f}")
print(f"control checks passed vs next month's rate: r = {r_next(ccv, rate):+.2f}")
n = months - 1
t = 2.08   # two-sided 5% t value for about 21 degrees of freedom
r_crit = t / math.sqrt(n - 2 + t * t)
print(f"with {n} pairs, |r| must exceed about {r_crit:.2f} to be unlikely by chance")total recordables: 68 in 2,413,692 hours inspections done vs next month's rate: r = +0.17 control checks passed vs next month's rate: r = -0.35 with 23 pairs, |r| must exceed about 0.41 to be unlikely by chance
The result surprised the working group. The relationship built into the data was real, and the correlation for control checks had the expected negative sign, but with only 23 pairs of months it did not reach the level at which it could be distinguished from chance. Inspection completion, which had no real effect, showed a small positive correlation, also within the range of chance. Two years of monthly data at a company of Harrowgate Foods Inc.'s size is simply not enough to prove or disprove a leading indicator by correlation alone.
That did not mean testing was pointless. It meant that the company had to combine several kinds of evidence. Nina would keep the correlation analysis running and add data as it came in. Elena would review every serious event and SIF-potential event to see whether the indicators had given warning beforehand. And the logic of each indicator, the link from a control to the hazard it prevents, would carry much of the weight. A lockout verification that fails is evidence of risk on the day it fails, whatever the correlation says.
Reviewing the set
The group agreed to review the whole indicator set once a year, at the management review described in HSE-404. Indicators that always sat at 100 percent would be redefined or retired, because they no longer told anyone anything. Indicators that turned out to be gamed would be paired with new measures or dropped. New hazards, such as a new production line, would get new indicators through the management of change process. Tanya Morris asked that the safety committees be part of the review, and that request became part of the procedure.
Common mistakes
MistakeBuilding indicators from whatever data already exist.
InsteadStart from serious hazards and critical controls, then find or create the data.
MistakeLeaving indicators undefined because their meaning seems obvious.
InsteadWrite an operational definition precise enough that two people count the same thing.
MistakeReporting dozens of indicators to every audience.
InsteadKeep a short set and show each audience the indicators it can act on.
MistakeSetting targets without responses.
InsteadSet attention and action thresholds with defined responses and owners.
MistakeConcluding that an indicator works or fails from a short correlation.
InsteadCombine correlation over time with event reviews and the logic linking the indicator to the hazard.
Summary and key terms
- Indicators should be chosen from serious hazards and critical controls, not from whatever data are available.
- Each indicator needs a specification with definition, formula, data source, owner, frequency, threshold, response, paired indicator and limitations.
- Operational definitions must be precise enough that two people count the same thing, including how samples are spread across shifts.
- A short tiered set lets each audience see the indicators it can act on.
- Thresholds with defined responses turn measurement into action and are harder to game than targets.
- Small datasets rarely prove a leading indicator by correlation, so testing combines statistics, event reviews and logic.
- Indicator specification
- A written description of an indicator covering definition, formula, data source, owner, thresholds and responses.
- Operational definition
- A definition precise enough that different people would measure the same thing in the same way.
- Paired indicator
- A second measure that would reveal if the first were being gamed.
- Attention level
- A threshold that triggers a review by the indicator owner.
- Action level
- A threshold that triggers a leadership review and a written action plan.
Practice problems
Work each problem on paper first, then reveal the answer to check.
What three questions did the group ask for each serious hazard before looking for data?
Show answer
What are the critical controls, how would we know if they were failing, and what data would show it?
Why did the lockout verification definition specify how verifications were spread across shifts?
Show answer
So that night shifts, where the serious injury had happened, were not under-sampled.
What is the paired indicator for corrective actions closed on time?
Show answer
The share of closed actions that pass an effectiveness check by someone other than the action owner.
What is the difference between an attention level and an action level?
Show answer
An attention level triggers a review by the owner; an action level triggers a leadership and committee review and a written action plan.
In the simulation, why did the real relationship fail to reach significance?
Show answer
Twenty-three pairs of months were too few to distinguish a moderate correlation from chance.
Lesson quiz · 5 questions
Score 60% or more to complete this lesson.
Create a free account to save your progress, take quizzes and earn a certificate.