
HSE-407 · Lesson 3 of 12 · 20 min
The limits and side effects of lagging indicators
Margaret Doyle opened the second meeting of the board of directors's safety committee with a question for Elena: 'If our injury rate is now calculated correctly, why shouldn't we just set a target to cut it in half and hold the managers to it?' It was a fair question, and many companies do exactly that. Elena's answer took most of the meeting, and it forms this lesson. Lagging indicators have real value, but they have five built-in limits, and when they are used as targets they create side effects that can make a company less safe.
Limit one: they arrive too late
An injury rate is a count of failures that have already hurt people. By the time it rises, the conditions that caused the injuries have usually been in place for months. At the Gainesville plant, the lockout shortcut that led to the spiral conveyor injury had been routine on the night sanitation shift for at least a year, according to the investigation. In that time the plant's rate had been steady. The measure gave no warning because the shortcut had not yet hurt anyone.
A measure that only moves after harm can tell a company whether it has been unlucky, but it cannot tell managers where to act next week. Margaret, who had seen aviation move from counting accidents to monitoring flight data, recognized the problem at once.
Limit two: they are dominated by chance
Lesson 1 showed how much an injury count varies at a constant level of risk. The smaller the site and the shorter the period, the worse the problem. A monthly rate for the Athens plant is zero most months and very high in any month with one case. Even for the company as a whole, with about 33 recordable cases a year, a change of five or six cases between years is well within normal variation. Targets set on such numbers end up rewarding and punishing managers for luck.
Limit three: they say little about serious harm
The most important limit is that the overall injury rate is a poor guide to the risk of death and life-changing injury. For decades, safety practice was shaped by the 'accident triangle' published by Herbert Heinrich in 1931, which suggested a fixed ratio between minor injuries, serious injuries and fatalities. If the ratio held, cutting minor injuries would cut serious ones in proportion.
The evidence since then has not supported a fixed ratio. Over the past two decades the national recordable injury rate in North America has roughly halved, while the rate of fatal injuries has fallen far less. Studies of large companies have found that many saw steep falls in recordable injuries with little change in serious injuries and fatalities. The explanation is that most minor injuries come from different causes than most serious ones. Better gloves prevent cuts. They do nothing about a forklift reversing into a pedestrian aisle.
Two disasters are often used to make the point. At the BP refinery in Texas City in 2005, an explosion killed 15 workers and injured about 180 more. The independent panel that reviewed BP's US refineries afterwards found that the company had relied heavily on personal injury rates as a measure of safety performance, and that those rates gave a misleading picture of process safety risk. In 2010, when the Deepwater Horizon drilling rig exploded in the Gulf of Mexico and killed 11 workers, senior managers were on board in part to mark the rig's long record without a days-away injury.
Harrowgate Foods Inc. is not a refinery, but it has its own high-energy hazards: the ammonia refrigeration system, spiral freezers and conveyors, mixers and slicers, ovens, forklift traffic in cold storage, and work at height on racking and mezzanines. The question for its framework was not whether minor injuries mattered, but whether a falling rate of minor injuries could be read as a falling risk of the next serious event. It could not.
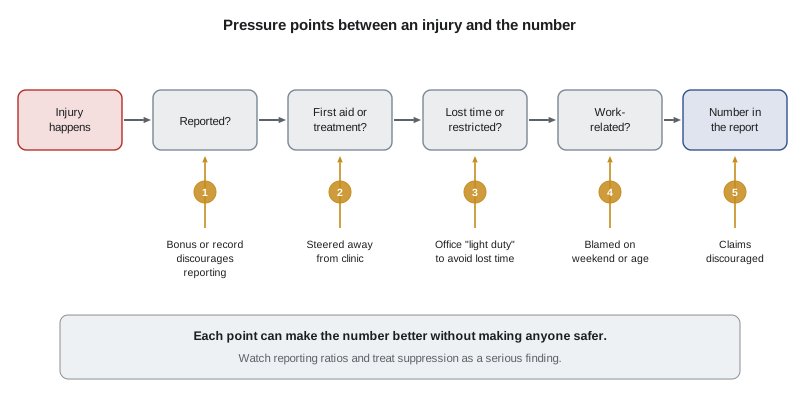
Limit four: they can be improved without improving safety
The fourth limit is the one that turns a weak measure into a harmful one. Between an injury and the number in a report there are several decisions, and each one can be influenced. The figure shows the main pressure points:
- Not reporting. A worker decides not to report a strain or cut because of a bonus, a team record, fear of discipline or a supervisor's reaction.
- Treating as first aid. A case that would need medical treatment is handled in the first aid room, or a worker is steered away from a clinic visit.
- Light duty to avoid lost time. An injured worker is brought in to sit in an office rather than stay home, so the case shows as restricted work rather than lost time.
- Classifying as not work-related. A back injury is blamed on weekend activities or a pre-existing condition without proper evidence.
- Discouraging claims. Workers are told that a claim will hurt the site's record or their own prospects.
Some of these practices have legitimate versions. Good early return-to-work programs, with suitable modified work agreed with the worker and the treating health professional, help people recover and keep their connection to work. Proper first aid is better than an unnecessary clinic visit. The line is crossed when the purpose of the practice is the number rather than the person.
Several of these practices are also illegal. section 11(c) of the OSH Act prohibits retaliation against workers who report injuries, and OSHA's recordkeeping rule requires employers to have a reasonable reporting procedure that does not deter reporting and prohibits retaliation for reporting a work-related injury or illness. OSHA has also said that incentive programs that deter reporting can violate the rule.
Limit five: they hide differences inside the average
A company rate of 5.43 is an average over three sites, several departments, employees and agency workers, day and night shifts. Lesson 2 showed that agency workers at McDonough were injured at a much higher rate than employees. The average hid that. Elena asked Nina to break the rates down by site, department, shift, employment type and length of service, and to report any group whose rate was clearly higher than the rest. The breakdown found two more patterns: workers in their first six months had about twice the rate of longer-serving workers, and the night sanitation crew at Gainesville had the highest rate of any group in the company.
Using ratios to watch for under-reporting
If people are not reporting minor injuries, the ratio of minor events to recordable injuries tends to fall. A site with healthy reporting usually records many first aid cases for each recordable case, and many near misses for each injury. Nina calculated these ratios for each site using last year's data.
# Reporting health ratios by site
data = {
    # site: (workers, near misses reported, first aid cases, recordable cases)
    "main plant":   (420, 310, 188, 22),
    "distribution": (110,  14,  24,  9),
    "sauces plant": ( 60,  52,  21,  2),
}
print(f"{'site':<14}{'NM per 100':>11}{'FA per rec':>11}{'NM per rec':>11}")
for site, (w, nm, fa, rec) in data.items():
print(f"{site:<14}{nm * 100 / w:>11.1f}{fa / rec:>11.1f}{nm / rec:>11.1f}")site NM per 100 FA per rec NM per rec main plant 73.8 8.5 14.1 distribution 12.7 2.7 1.6 sauces plant 86.7 10.5 26.0
The McDonough site stood out. It reported about 13 near misses per 100 workers a year, compared with 74 and 87 at the other sites, and only about 2.7 first aid cases for each recordable case. Given what was known about its forklift traffic, it was not credible that the site had so few near misses. The likelier explanation was that people had stopped reporting them, which matched the culture survey from HSE-401 and the findings of the forklift investigation in HSE-403. The ratios did not prove under-reporting, but they told Elena where to look.
Worked problem
Testing a proposed injury target
Show solution
- Richard Lam proposed a target of a 30 percent cut in the company's recordable rate, linked to managers' annual bonuses. Elena tested it against the five limits.
- Timing: the rate would show success or failure only after the year ended, too late to guide action during it.
- Chance: with about 33 cases a year, a 30 percent cut means about 10 fewer cases, but normal variation alone could produce a change of that size in either direction, as Lesson 10 shows.
- Serious harm: the target would reward cutting any recordable case, so effort would flow to the easiest cases, such as cuts and strains, rather than the high-energy hazards.
- Side effects: a bonus tied to the count would create pressure at every point in the figure, especially at McDonough, where reporting was already weak.
Answer: The committee dropped the bonus link. It kept the recordable rate as a reported measure, with no bonus attached, and asked for leading indicators that managers could influence directly and that related to serious harm.
What lagging indicators are still good for
Elena did not argue for abandoning lagging indicators, and the committee did not. They remain the most direct evidence of harm, they are what regulators, insurers, customers and the public look at, and over several years and many hours they do show real trends. They also feed learning: every injury is a chance to investigate and improve, whatever it does to the rate.
The working group agreed on five rules for using them in the new framework:
- Report lagging indicators as counts and rates together, over rolling twelve-month periods, with an indication of how much variation is normal.
- Never link pay, bonuses or contracts for internal managers to injury counts or rates.
- Report serious injuries and serious near misses separately from the overall rate, with the investigation status of each.
- Track reporting health ratios alongside injury rates, and treat a sharp fall in reporting as a warning sign, not good news.
- Break down rates by group to find where harm concentrates.
Removing the 'days without a days-away injury' sign at the Athens plant was the first visible change. Some workers liked the sign, and the plant manager was worried about how removing it would look. Tanya Morris, the safety committee co-chair at Gainesville, suggested replacing it with a board showing the hazards reported that month and what had been done about each. That board turned out to be one of the most popular changes of the whole project.
Lagging indicators in contracts and prequalification
The same limits apply when Harrowgate Foods Inc. judges other companies. In HSE-406, the purchasing team prequalified contractors partly on their total recordable incident rate (TRIR) and experience modification rate (EMR). Elena asked Kevin Doucette to keep those measures but to stop using them as pass-or-fail gates for small firms. A contractor with eight workers can go three years without a recordable injury by luck, and one injury can push its rate above any threshold. For small firms the team now looks at the contractor's safety program, its references and its record on Harrowgate Foods Inc. sites, and treats the rates as one piece of evidence among several. It also asks larger contractors for counts and hours, not just rates, so that it can see how much each rate rests on.
Common mistakes
MistakeSetting an injury rate target and linking it to bonuses.
InsteadReport injury rates without incentives and reward activities that control serious hazards.
MistakeAssuming fewer minor injuries means fewer serious ones.
InsteadMeasure serious injuries, serious near misses and critical controls separately.
MistakeReading a fall in near-miss reports as good news.
InsteadTreat a fall in reporting as a possible sign of suppression and investigate.
MistakeReporting only the company average.
InsteadBreak rates down by site, department, shift, employment type and length of service.
MistakeUsing light duty to keep cases off the lost-time count.
InsteadOffer modified work for the worker's recovery, agreed with the worker and the treating health professional.
Summary and key terms
- Lagging indicators arrive after harm, vary widely by chance, and say little about serious injury risk.
- Evidence does not support a fixed ratio between minor and serious injuries, so cutting minor injuries does not reliably cut serious ones.
- Texas City in 2005 and Deepwater Horizon in 2010 showed low personal injury rates alongside catastrophic risk.
- Every step from injury to report can be pressured, and some suppression practices are illegal.
- Averages hide groups at higher risk, such as new, agency and night shift workers.
- Reporting health ratios, such as near misses per 100 workers and first aid cases per recordable, help detect under-reporting.
- Accident triangle
- Heinrich's 1931 idea of a fixed ratio between minor injuries, serious injuries and deaths.
- Under-reporting
- Failure to report injuries or near misses that occurred, which makes rates look better than reality.
- Reporting health ratio
- A ratio such as near misses or first aid cases per recordable injury, used to check whether reporting is healthy.
- Modified work
- Suitable temporary work for an injured worker that supports recovery, agreed with the worker and health professional.
- Stratification
- Breaking a rate down by groups such as site, shift or employment type to find where harm concentrates.
Practice problems
Work each problem on paper first, then reveal the answer to check.
List the five limits of lagging indicators described in this lesson.
Show answer
They arrive late, are dominated by chance, say little about serious harm, can be improved without improving safety, and hide differences inside the average.
What did the review after Texas City find about BP's use of injury rates?
Show answer
It found heavy reliance on personal injury rates, which gave a misleading picture of process safety risk.
A site reports 15 near misses per 100 workers while similar sites report about 80. What should you suspect?
Show answer
Under-reporting, which should be investigated before the figure is read as good performance.
When is light duty legitimate?
Show answer
When it is suitable modified work agreed with the worker and the treating health professional to support recovery, not a way to avoid a lost-time case.
What replaced the days-without sign at the sauces plant?
Show answer
A board showing the hazards reported that month and what had been done about each.
Lesson quiz · 5 questions
Score 60% or more to complete this lesson.
Create a free account to save your progress, take quizzes and earn a certificate.