
HSE-407 · Lesson 11 of 12 · 20 min
Dashboards and reporting to leadership and the board
The old one-page report had told the board of directors that everything was green. Margaret Doyle's committee wanted something different, but it did not want a 40-page pack either. 'Directors have a few hours a quarter for safety,' she told Elena. 'Show us what could kill someone, whether the controls are holding, what has gone wrong and what you need from us. Then let us ask questions.' This lesson covers how Harrowgate Foods Inc. designed reports for each level of the organization, and how the board learned to use them.
Different audiences, different questions
Each level of the organization needs safety information to make different decisions. The working group set out four tiers of reporting:
- Supervisors and crews need daily and weekly information about their own area: today's hazards, open findings, verification results, near misses and actions due. They act within hours.
- Site leadership teams need weekly and monthly information across the site: all fourteen indicators, trends, overdue actions, audit findings and investigations. They act within days and weeks.
- The executive team needs monthly information across sites: the main indicators with trends, serious events, overdue major findings and resource decisions. They act within weeks and months.
- The board needs quarterly information on whether serious risks are controlled and the system is working, with enough detail to challenge management. It acts on strategy, resources, oversight and accountability.
The same data feed all four tiers, so that numbers match at every level. What changes is the level of detail, the time period and the questions each report is built to answer.
Principles for a safety dashboard
Nina and Elena wrote a short set of design rules before building anything, drawing on the lessons so far:
- Lead with serious risk. The first thing on every report is serious events and SIF-potential events, followed by critical control status. Injury rates come later.
- Show trends, not snapshots. Every indicator is shown over at least twelve months, with control limits where they apply, so readers can see whether a change is a signal.
- Show counts with rates. A rate is always accompanied by the count behind it.
- Define every color. Status colors come only from the written thresholds in each indicator's specification.
- Say so what. Each section has a short written commentary: what changed, why, and what is being done.
- Ask for decisions. Reports end with the decisions or support needed from the audience.
- Keep it short. The board report is two pages plus appendices; the site report fits on one screen.
Status colors that mean something
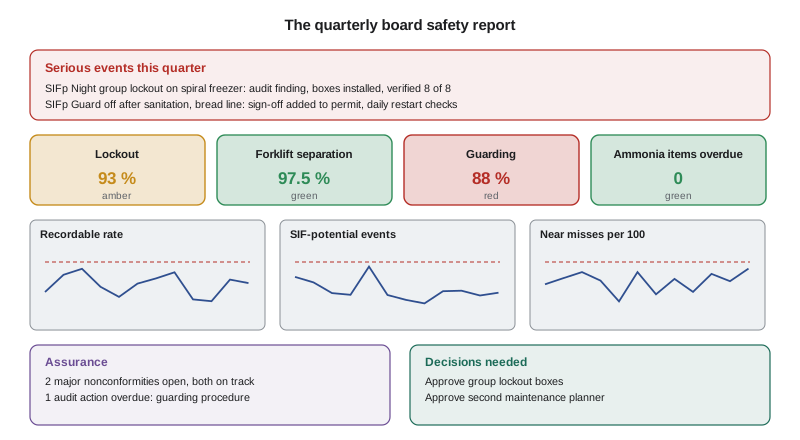
Red, amber and green colors are popular because they are quick to read. They are dangerous for the same reason. In the old report, a site manager's judgment decided the color, and green was the default. The new rule was mechanical: each indicator's specification set an attention level and an action level, as described in Lesson 5, and the color followed automatically from the value. The script below applies the rule to one quarter's figures for the Gainesville plant.
# Turn indicator values into status levels using written thresholds
indicators = [
    # name, value, attention level, action level, higher is better?
    ("lockout verifications passed %",        93.0, 95.0, 90.0, True),
    ("forklift separation checks passed %",   97.5, 95.0, 90.0, True),
    ("guarding checks passed %",              88.0, 95.0, 90.0, True),
    ("ammonia: specialist items overdue",      0,    1,    3,   False),
    ("SIF-potential events per 200,000 h",     5.1,  6.0,  8.0, False),
    ("SIFp events investigated in 10 days %", 71.0, 90.0, 75.0, True),
    ("high-risk findings open > 30 days",      6,    3,    6,   False),
    ("actions closed on time %",              84.0, 85.0, 70.0, True),
]
def status(v, attn, act, higher_better):
    if higher_better:
        return "red" if v < act else "amber" if v < attn else "green"
    return "red" if v >= act else "amber" if v >= attn else "green"

counts = {"green": 0, "amber": 0, "red": 0}
for name, v, attn, act, hb in indicators:
    s = status(v, attn, act, hb)
    counts[s] += 1
    print(f"{name:<40}{v:>7}  {s}")
print(counts)lockout verifications passed % 93.0 amber
forklift separation checks passed % 97.5 green
guarding checks passed % 88.0 red
ammonia: specialist items overdue 0 green
SIF-potential events per 200,000 h 5.1 green
SIFp events investigated in 10 days % 71.0 red
high-risk findings open > 30 days 6 red
actions closed on time % 84.0 amber
{'green': 3, 'amber': 2, 'red': 3}Three indicators were red and two amber. The guarding result surprised the plant manager, Marcus Bell: the verification teams had found guards removed for cleaning and not replaced on several lines. The late SIF-potential investigations and the old high-risk findings pointed to the same cause, a maintenance team stretched by a new production line. Under the old reporting, the plant would have been shown as green, because it had had a good quarter for injuries.
Elena also warned against what she called watermelon reporting: green on the outside and red on the inside. A summary that shows green because most indicators are green can hide one red indicator that matters more than all the others. The board report therefore never averaged or combined colors. A red critical control was shown as red, with its commentary, whatever else was green.
The board report
The quarterly board report that emerged had six sections, always in the same order:
- Serious events: every SIF and every SIF-potential event rated high, with a one-line description, the investigation status and the main actions.
- Critical controls: the status of the four critical control indicators at each site, with commentary on any amber or red.
- Trends: small charts of the recordable rate, the DART rate, SIF-potential events and near-miss reporting, each with control limits and counts.
- Assurance: the results of audits completed in the quarter, open major nonconformities and their due dates, and any overdue actions from previous audits.
- People and culture: the pulse survey results on stopping unsafe work and on whether reported problems are fixed, and any significant workforce changes such as new shifts or high use of agency workers.
- Decisions and support needed: resources, approvals or changes in priorities that management is asking the board to consider.
The first report under the new format went to the committee nine months into the project. It was less comfortable than the old one. It showed a group lockout practice on night shift, two overdue ammonia detector calibrations, a near-miss reporting rate at McDonough far below the other sites, and guarding problems at Gainesville. It also showed what was being done about each, and asked the board to approve the cost of group lockout boxes and an extra maintenance planner. Both were approved at the meeting.
The board's role and duties
Directors are not expected to manage safety, but they are expected to oversee it. In corporate law, the Delaware courts, whose decisions on directors' duties are followed widely, have held that directors must make a good-faith effort to put in place a system for monitoring and reporting on risks that are central to the company's business. In Marchand v. Barnhill in 2019, the Delaware Supreme Court allowed claims to proceed against the directors of Blue Bell Creameries after a listeria outbreak, because the board had no system for monitoring food safety, the company's most important compliance risk. For a food manufacturer, the lesson applies to worker safety too. A board that receives only reassuring injury counts would find it hard to show that it had made a good-faith effort to monitor serious safety risks.
Margaret drew up a short list of questions that directors on her committee were encouraged to ask at every meeting. They became an appendix to the report template:
- What are the events this quarter that could have killed someone, and what did we learn from them?
- Which critical controls are weakest, and what is being done?
- What have the audits found that management did not already know?
- Which actions are overdue, and what is stopping them?
- What are workers telling us that the numbers do not show?
- What do you need from us?
Seeing for themselves
Reports are not the only way directors learn about safety. The committee began visiting a site before each quarterly meeting, with an agreed purpose for each visit. On one visit to McDonough, two directors spent an hour in the cold storage aisles at night with Sam Pellerin and a night supervisor, watching forklift and picker traffic. They came back with questions about agency worker training that no report had prompted. Elena encouraged these visits but asked directors to follow two rules: talk to workers as well as managers, and bring questions back to the meeting rather than issuing instructions on the floor.
Worked problem
Rewriting a commentary
Show solution
- The first draft of the commentary on the guarding indicator read: 'Guarding verification pass rate was 88 percent against a threshold of 90 percent. Action plan in place.'
- Elena asked what a director would need to know: what was failing, why, how serious it was, and what was being done by when.
- The rewritten commentary read: 'Guards were found off after sanitation on 6 of 50 checks, all on the bread and pastry lines, where cleaning now takes longer since the new line started. No injuries resulted, but two cases were rated SIF potential. Sanitation crews now sign off guard replacement on the lockout permit before locks are removed, and supervisors check every restart for four weeks. Target: back above 95 percent by the end of next quarter.'
- The new commentary also linked the problem to the maintenance resourcing decision that the report asked the board to make.
Answer: A good commentary says what failed, where, why, how serious it was, what is being done and by when, and connects it to any decision the board needs to make.
Reporting to workers
The fifth audience, which the first design had left out, was the workforce. Tanya Morris pointed out that workers were asked to report hazards and near misses and to take part in verifications, but rarely saw what happened to the information. The working group added a monthly one-page summary for each site, posted on the boards that had replaced the days-without signs and discussed at the safety committee meeting. It showed the hazards reported that month and what had been done, the critical control results for the site in plain language, any serious events and what had changed because of them, and the actions still open with their owners. It used no injury targets and no league tables of departments.
The summary had a measurable effect. In the two quarters after it started, near-miss reports at McDonough roughly doubled, and the pulse survey score for 'problems I report get fixed' rose more than any other question. Sam Pellerin's explanation was simple: people report more when they can see that reporting leads somewhere.
Reporting outside the company
Customers, insurers and investors increasingly ask for safety information too, often as part of sustainability questionnaires. Harrowgate Foods Inc. decided that anything it reported outside the company would come from the same data and definitions as its internal reports, with the definitions stated, and that it would report serious injuries and critical control results alongside injury rates rather than choosing whichever measure looked best that year.
Common mistakes
MistakeLeading the board report with the injury rate.
InsteadLead with serious events and critical control status.
MistakeLetting managers choose status colors.
InsteadDerive colors mechanically from each indicator's written thresholds.
MistakeCombining colors into an overall status.
InsteadShow each red critical control on its own, with commentary.
MistakePresenting numbers without explanation.
InsteadAdd commentary on what changed, why and what is being done.
MistakeEnding reports without asking for anything.
InsteadState the decisions or support needed from the audience.
Summary and key terms
- Supervisors, site leaders, executives and the board need different levels of detail from the same data.
- Dashboards should lead with serious risk, show trends with counts, define colors, explain changes and ask for decisions.
- Status colors must follow written thresholds, and red critical controls must never be averaged away.
- The board report covers serious events, critical controls, trends, assurance, people and culture, and decisions needed.
- Directors must make a good-faith effort to monitor mission-critical risks, as Marchand v. Barnhill showed.
- Board questions and site visits help directors challenge and understand the information they receive.
- Dashboard
- A display of selected indicators for a particular audience, usually with trends and status.
- Watermelon reporting
- Reporting that looks green overall while hiding red problems inside.
- Commentary
- Written explanation of what changed in an indicator, why, and what is being done.
- Assurance
- Evidence from audits and verifications that controls and systems are working as intended.
- Oversight
- The board's role of monitoring management's handling of risks and holding it to account.
Practice problems
Work each problem on paper first, then reveal the answer to check.
Name the four reporting tiers and how quickly each acts.
Show answer
Supervisors and crews within hours, site leadership within days and weeks, the executive within weeks and months, and the board on strategy, resources and oversight quarterly.
What comes first in every report?
Show answer
Serious events and SIF-potential events, followed by critical control status.
Why did the board report never combine colors?
Show answer
Because one red critical control can matter more than many green indicators, and combining them would hide it.
What two rules did Elena ask directors to follow on site visits?
Show answer
Talk to workers as well as managers, and bring questions back to the meeting rather than issuing instructions on the floor.
List four things a good commentary should say.
Show answer
What failed, where and why, how serious it was, and what is being done by when.
Lesson quiz · 5 questions
Score 60% or more to complete this lesson.
Create a free account to save your progress, take quizzes and earn a certificate.