
HSE-103 · Lesson 6 of 12 · 25 min
Rating risk: likelihood, severity and risk matrices
Once hazards are identified, the next question is how serious each one is. Rating risk helps decide which hazards need urgent action, which controls are worth their cost, and whether the remaining risk is acceptable. Most organizations use a risk matrix, a simple grid that combines likelihood and severity into a risk level. Matrices are easy to use and communicate, but they have well-documented weaknesses that can mislead decision makers if they are used carelessly. This lesson explains qualitative, semi-quantitative and quantitative risk rating, how to define likelihood and severity scales, how to build and use a risk matrix, the pitfalls of matrices, risk tolerance and the ALARP principle, prioritizing high-consequence hazards, and how to rate risk consistently in teams.
Qualitative, semi-quantitative and quantitative approaches
Risk can be rated in three broad ways. Qualitative approaches describe likelihood and severity in words, such as "unlikely" and "major", and combine them into categories such as low, medium and high. Semi-quantitative approaches assign numbers to the categories, such as 1 to 5, and multiply or add them to produce a score. Quantitative approaches estimate actual probabilities and consequences, such as an annual probability of a fatality of one in a million, using data and models; they are used mainly for major hazards in industries such as chemicals, oil and gas, nuclear power and aviation. Most workplace assessments use qualitative or semi-quantitative matrices, which require judgment but no specialized data.
Defining likelihood
Likelihood describes how probable it is that harm will occur, taking into account exposure and existing controls. Good scales define each level with concrete descriptions so that different people rate consistently:
| Level | Descriptor | Example definition |
|---|---|---|
| 1 | Rare | Could happen only in exceptional circumstances; not known in the industry |
| 2 | Unlikely | Could happen; has occurred in the industry |
| 3 | Possible | Might happen; has occurred in this organization |
| 4 | Likely | Will probably happen; occurs several times a year here |
| 5 | Almost certain | Expected to happen; occurs regularly |
Some organizations define likelihood by frequency, such as "once in ten years" or "monthly", or by probability ranges. The important point is to consider realistic exposure: how many people, how often, for how long, and how well existing controls work in practice, not just on paper.
Defining severity
Severity, or consequence, describes how bad the harm would be. For people, scales usually range from first aid injuries to fatalities:
| Level | Descriptor | Example definition (people) |
|---|---|---|
| 1 | Insignificant | First aid only |
| 2 | Minor | Medical treatment; no lost time |
| 3 | Moderate | Lost-time injury; full recovery expected |
| 4 | Major | Permanent disability, serious illness or hospitalization |
| 5 | Catastrophic | One or more fatalities |
Severity scales often include other dimensions, such as environmental harm, property damage, production loss and reputation, so that one matrix can be used across risk types. When rating severity, consider the credible worst outcome, not only the most likely one: a fall from a two-meter platform usually causes bruises but can cause a fatal head injury.
The risk matrix
A risk matrix places likelihood on one axis and severity on the other. Each cell is assigned a risk level, often shown in colors or shading, with actions required for each level. A common semi-quantitative approach calculates a score:
Scores are then grouped into bands, for example 1–4 low, 5–9 medium, 10–16 high and 20–25 extreme, with each band linked to a required response: low risks are managed by routine procedures; medium risks need controls and monitoring; high risks need prompt action and management attention; extreme risks require work to stop or not start until the risk is reduced.
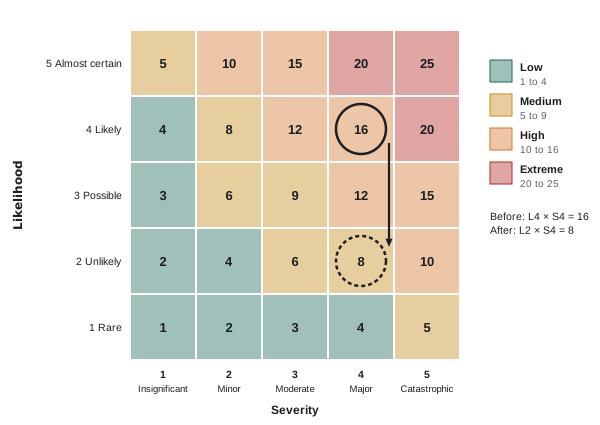
| Risk band | Score range | Typical required response |
|---|---|---|
| Low | 1–4 | Manage by routine procedures; monitor |
| Medium | 5–9 | Implement controls; supervisor review |
| High | 10–16 | Prompt action; management approval to proceed |
| Extreme | 20–25 | Stop or do not start work until risk is reduced |
Worked problem
Rating three hazards
In a print shop, a team rates three hazards on the 5 × 5 matrix: (a) paper cuts while handling stock, likely (4) and insignificant (1); (b) a hand caught in the guillotine cutter if the two-hand control is bypassed, unlikely (2) and major (4); (c) solvent vapors during manual cleaning of presses in a small room, possible (3) and moderate (3). Rank them.
Show solution
- Paper cuts: R = 4 × 1 = 4, low.
- Guillotine: R = 2 × 4 = 8, medium, but with a major (amputation) consequence.
- Solvent vapors: R = 3 × 3 = 9, medium.
- Ranking by score puts solvent vapors first and the guillotine second.
- Because the guillotine could cause a permanent injury, many organizations would also flag it as a priority under a high-consequence rule, checking the interlock and two-hand control integrity.
Answer: Scores of 4, 8 and 9 rank the solvent cleaning highest, but the guillotine's major consequence means it also deserves priority attention.
Pitfalls of risk matrices
Risk matrices are widely used, but safety researchers and risk analysts have described important weaknesses:
- Subjectivity and inconsistency: different people rate the same hazard differently, especially for likelihood, which is hard to judge for rare events.
- Range compression: very different risks can fall in the same cell, and a coarse scale cannot distinguish them.
- Misleading arithmetic: multiplying ordinal numbers treats the difference between "rare" and "unlikely" as if it were measured, and can rank a frequent minor hazard above a rare catastrophic one. A score of 5 can mean a certain first aid case or a rare fatality.
- Underweighting severe consequences: high-severity, low-likelihood hazards, the kind that cause fatalities and disasters, may end up rated only "medium" and receive little attention.
- Gaming and optimism: people may lower ratings to avoid the work or paperwork required for high risks, or assume controls work better than they do.
- False precision: a numerical score can make a judgment look more objective than it is.
These problems do not mean matrices should be abandoned, but they should be used carefully: define scales clearly, calibrate teams, treat the result as a guide to discussion rather than an exact measure, and add rules that give priority to severe consequences.
High-consequence hazards
Because serious injuries and fatalities are rare, their likelihood is easy to underestimate, especially in a workplace with a good injury record. Many organizations now treat any hazard with a potential fatal or life-altering consequence as a priority regardless of likelihood, requiring robust controls such as engineering safeguards and verification of critical controls. Examples include work at height, suspended loads, mobile equipment near pedestrians, hazardous energy, confined spaces, excavations and energized electrical work. Asking "What is the worst credible outcome, and what directly stops it?" focuses attention on the controls that matter most.
Risk tolerance and ALARP
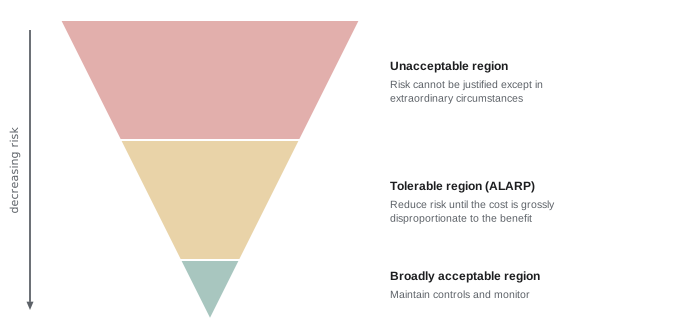
No activity is free of risk, so organizations must decide how much risk is acceptable or tolerable. In occupational health and safety law in both Canada and the United States, employers must take reasonable or feasible measures to protect workers, which in practice means reducing risks as far as is reasonably practicable. The ALARP principle, "as low as reasonably practicable", widely used in the United Kingdom and in major hazard industries, expresses this idea: risks must be reduced until the cost, time or difficulty of further reduction is grossly disproportionate to the benefit gained. The ALARP model divides risk into three regions: an unacceptable region where risk must be reduced regardless of cost, except in extraordinary circumstances; a tolerable region in the middle where risk must be reduced as far as reasonably practicable; and a broadly acceptable region where risk is so low that further reduction is normally not required, though it must be maintained.
Rating risk consistently in teams
Consistency improves when organizations use a single, well-defined matrix with clear descriptors and examples for each level; train people to use it; rate risks in small groups that include workers and supervisors; record the reasoning behind each rating, not just the number; compare ratings across sites and departments; and periodically calibrate, for example by having teams rate the same scenarios and discuss differences. Ratings should also be revisited when new information arrives, such as an incident, a near miss or measurement data. Remember that the purpose of rating is to decide what to do; spending more time debating whether a risk is 8 or 9 than deciding how to control it misses the point.
Initial and residual risk
Risk is usually rated twice: before additional controls, called initial or inherent risk (some organizations rate it with existing controls, others as if no controls were present; be clear which), and after proposed controls, called residual risk. Comparing the two shows the value of the controls. Residual risk should be low enough to meet the organization's criteria; if it remains high, more effective controls are needed or the work should not proceed. Residual ratings should be realistic: assuming that a procedure will always be followed or PPE always worn correctly overstates the risk reduction.
Calibrating the scales
A risk matrix is only as good as the definitions behind its scales. Likelihood categories work best when they are tied to observable frequencies, such as "expected to occur several times a year at this site" or "has occurred in the industry but not here", rather than words like "possible" that different people interpret differently. Severity categories work best when they describe concrete outcomes, such as "first aid only", "lost-time injury", "permanent disability" and "one or more fatalities". Some organizations add columns for other consequences, such as environmental damage, property loss or reputation, and take the highest rating. Before using a matrix, teams should rate a few familiar examples together and compare their answers; large differences show that the definitions need work or that the team needs more discussion.
Common pitfalls in risk rating
Risk ratings are judgments, and judgments can be biased. People tend to underestimate the likelihood of rare but catastrophic events, especially if they have never seen one, and to overestimate risks that are vivid or recently in the news. Familiarity breeds complacency: a task done safely a thousand times feels safe, even if its controls are weak. Teams sometimes rate likelihood lower after adding controls that exist only on paper. Averaging ratings across a group can hide a well-founded concern from one experienced worker. And multiplying likelihood by severity can make a frequent minor hazard look as important as a rare fatal one, even though most organizations want to treat potential fatalities differently. Good practice is to flag any hazard with catastrophic potential for special attention, regardless of its score, to rate residual risk only for controls that are actually in place, and to record the reasoning behind each rating so that it can be checked and challenged.
Quantitative risk
Some industries go further and estimate risk in numbers, such as the annual probability of a fatality for an individual worker. Regulators and companies in some countries use criteria such as one in a thousand per year as an upper limit of tolerability for workers and one in a million per year as broadly acceptable. These figures help in comparing very different hazards and making decisions about major investments, but they rely on data and models with large uncertainties and require specialist expertise.
Documenting risk decisions
Whatever method is used, the risk rating should be recorded alongside the hazard, the existing controls, the residual rating after additional controls and the name of the person who accepted the residual risk. Accepting a residual risk is a management decision, and the level of authority required should rise with the level of risk: a supervisor may accept a low residual risk, but a medium or high residual risk should require approval from a senior manager. This makes responsibility clear and ensures that serious risks are seen by people with the authority to fund further controls.
Whichever matrix is chosen, it should be used consistently across the organization, so that ratings from different departments and sites can be compared and priorities set fairly.
Common mistakes
MistakeTreating risk scores as precise measurements.
InsteadUse them as a guide for discussion and priorities.
MistakeRating only the most likely outcome.
InsteadConsider the credible worst outcome.
MistakeLetting rare catastrophic hazards fall to medium priority.
InsteadGive priority to high-consequence hazards.
MistakeLowering ratings to avoid paperwork.
InsteadRate honestly and record the reasoning.
MistakeAssuming administrative controls always work.
InsteadRate residual risk realistically.
Summary and key terms
- Risk can be rated qualitatively, semi-quantitatively or quantitatively.
- Clear likelihood and severity scales improve consistency.
- A risk matrix combines likelihood and severity into bands with required actions.
- Matrices have pitfalls: subjectivity, compression, misleading arithmetic and underweighting severe risks.
- Hazards with fatal potential deserve priority regardless of likelihood.
- ALARP means reducing risk until further reduction is grossly disproportionate.
- Rate initial and residual risk realistically and consistently in teams.
- Likelihood
- How probable it is that harm will occur.
- Severity
- How bad the harm would be.
- Risk matrix
- Grid combining likelihood and severity.
- Risk score
- Number derived from likelihood and severity ratings.
- Risk band
- Range of scores linked to a required response.
- Credible worst case
- The most severe realistic outcome.
- ALARP
- As low as reasonably practicable.
- Tolerable risk
- Risk accepted only when reduced as far as reasonably practicable.
- Inherent risk
- Risk before additional controls.
- Residual risk
- Risk remaining after controls.
Practice problems
Work each problem on paper first, then reveal the answer to check.
Name the three approaches to rating risk.
Show answer
Qualitative, semi-quantitative, quantitative.
What should likelihood ratings consider?
Show answer
Exposure and how well existing controls work in practice.
What is the score for likelihood 3 and severity 5?
Show answer
15.
Which band is a score of 12 in the example scheme?
Show answer
High.
Name three pitfalls of risk matrices.
Show answer
Subjectivity, range compression, misleading arithmetic, underweighting severity, gaming.
Why can a score of 5 mislead?
Show answer
It can mean a certain minor injury or a rare fatality.
What question focuses on high-consequence hazards?
Show answer
What is the worst credible outcome and what directly stops it?
What does ALARP mean?
Show answer
As low as reasonably practicable.
Name the three ALARP regions.
Show answer
Unacceptable, tolerable, broadly acceptable.
What is residual risk?
Show answer
Risk remaining after controls.
Lesson quiz · 5 questions
Score 60% or more to complete this lesson.
Create a free account to save your progress, take quizzes and earn a certificate.