
ENGG-401 · Lesson 8 of 12 · 27 min
Benefit-cost analysis and public projects
Highways, transit lines, water systems, flood defenses, hospitals and schools are paid for by the public and are meant to benefit the public. Their value cannot be judged by profit alone: a new interchange earns no revenue but saves travelers time, prevents collisions and reduces vehicle operating costs. Public agencies therefore use benefit-cost analysis (BCA), which compares the monetized benefits to society with the costs of a project. Engineers play a central role in these analyses, estimating construction and maintenance costs and quantifying benefits such as travel time savings and reduced flood damage. This lesson covers the nature of public projects, identifying benefits, disbenefits and costs, monetizing benefits, the social discount rate, the benefit-cost ratio and its forms, incremental benefit-cost analysis, distributional and non-monetized effects, and the strengths and criticisms of the method.
How public projects differ
Public projects differ from private investments in several ways. They often have very long lives, 50 to 100 years for bridges, dams and tunnels. Their benefits accrue to the public at large rather than to the owner, and many are not sold in markets, so they must be estimated indirectly. They are financed by taxes, user fees or government borrowing rather than equity. Their objectives include equity, safety, environmental quality and economic development as well as efficiency. And they involve many stakeholders and political processes. Public-private partnerships (P3s), in which private firms design, build, finance, operate or maintain public infrastructure under long-term contracts, combine elements of both worlds and require value-for-money analyses comparing the partnership with traditional public delivery.
Benefits, disbenefits and costs
Benefit-cost analysis classifies effects from the point of view of society:
- Benefits are favorable effects on the public: time saved, collisions avoided, flood damage prevented, cleaner water, recreation opportunities.
- Disbenefits are unfavorable effects on the public: noise, loss of land, disruption during construction, environmental harm, increased traffic on nearby roads.
- Costs are the expenditures of the sponsoring agency: design, land acquisition, construction, operation, maintenance and eventual rehabilitation, minus any salvage value.
Transfers, payments from one group to another that create no net value for society, such as taxes, subsidies and some fees, should not be counted as benefits or costs in a societal analysis, although they matter for financial and distributional analysis. Similarly, secondary effects, such as increased business for restaurants near a new highway, are often transfers of activity from elsewhere and are counted only with care.
Monetizing benefits
Many benefits of public projects are not traded in markets, so analysts use established methods to put money values on them:
| Benefit | Typical valuation approach |
|---|---|
| Travel time savings | Value of time per hour, often a share of wage rates, differing by trip purpose |
| Collision reduction | Value of a statistical life and injury costs times collisions avoided |
| Vehicle operating cost savings | Fuel, maintenance and depreciation per kilometer saved |
| Flood damage avoided | Expected annual damage reduction from flood frequency curves |
| Emissions reduction | Social cost of carbon and health damage costs per metric ton |
| Recreation | Travel cost and contingent valuation methods |
Governments publish standard values to keep analyses consistent, such as values of travel time and of a statistical life, which transportation agencies update periodically. The value of a statistical life is not the value of any particular person; it reflects how much people are willing to pay for small reductions in risk, aggregated across many people. Engineers must use the values specified by the agency they work for and document them clearly.
Expected annual damage
For flood control and other hazard-reduction projects, benefits are calculated as expected annual damage avoided. If floods of different sizes occur with known annual probabilities, the expected annual damage is the sum of each flood's damage times its probability, or more precisely the area under the damage-probability curve. A levee that eliminates damage from floods up to the 100-year flood, with an annual exceedance probability of 1 %, removes the corresponding part of the expected damage. Climate change complicates these estimates, because flood probabilities are shifting, and many agencies now require analyses with future climate scenarios.
The social discount rate
The discount rate for public projects reflects society's time preference and the opportunity cost of public funds: money spent on a highway could have been left with taxpayers or used for other public purposes. Choosing the rate is contentious, because long-lived projects such as climate adaptation, nuclear waste storage or major transit lines look very different at 3 % than at 7 %. Low rates favor projects with long-term benefits; high rates favor projects with quick payoffs.
In the United States, federal guidance comes from the Office of Management and Budget: Circular A-4 for regulatory analysis and Circular A-94 for federal programs and projects. A 2023 revision of Circular A-4 lowered the default real rate to 2 %, but the current administration has reverted to the earlier 2003 guidance, which uses real rates of 3 % and 7 % for regulatory analysis. State transportation departments and federal grant programs such as those administered by the US Department of Transportation specify the rates and values to be used in benefit-cost analyses for grant applications.
Because rates change with policy, engineers should always confirm the rate specified for a particular analysis and show results at other rates in a sensitivity analysis.
The benefit-cost ratio
The benefit-cost ratio compares the present worth (or annual worth) of benefits with that of costs, all at the social discount rate. The conventional form treats disbenefits as reductions in benefits:
A project is economically justified if \(B/C \ge 1.0\), which is equivalent to a positive net present value of benefits minus disbenefits minus costs. A modified form subtracts operating and maintenance costs from the numerator, leaving only capital costs in the denominator; it gives a different numerical ratio but always the same accept or reject decision, because both ratios exceed 1 exactly when net benefits are positive. The ratio is unaffected by whether present or annual worths are used, as long as they are consistent.
Worked problem
Benefit-cost ratio for a safety upgrade
A highway safety upgrade costs $12 million to build and $0.3 million a year to maintain over 30 years. It is expected to reduce collisions worth $1.6 million a year and save $0.4 million a year in travel time, with disbenefits of $0.1 million a year from construction-related and noise effects spread over its life. At a real social discount rate of 7 %, find the conventional and modified B/C ratios.
Show solution
- \((P/A, 7\,\%, 30) = 12.409\).
- PW of benefits: \(2.0 \times 12.409 = 24.82\) million; disbenefits: \(0.1 \times 12.409 = 1.24\) million.
- PW of costs: \(12 + 0.3 \times 12.409 = 15.72\) million.
- Conventional: \(B/C = (24.82 - 1.24)/15.72 = 1.50\).
- Modified: \((24.82 - 1.24 - 3.72)/12 = 1.65\).
Answer: Both ratios exceed 1 (1.50 and 1.65), so the upgrade is justified; at 3 %, the conventional ratio rises to about 2.1.
Incremental benefit-cost analysis
As with rates of return, choosing among mutually exclusive public alternatives by their individual B/C ratios can be wrong. The correct approach is incremental: order alternatives by increasing cost, start with the cheapest justified alternative (or do-nothing), and test each more expensive alternative by the ratio of incremental benefits to incremental costs. If \(\Delta B / \Delta C \ge 1\), the more expensive alternative is preferred.
Worked problem
Choosing between two designs
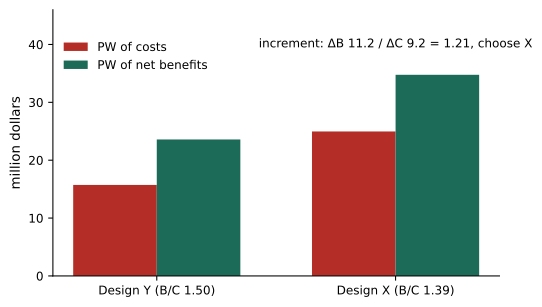
Design Y is the safety upgrade above (B/C = 1.50). Design X is a full interchange costing $20 million plus $0.4 million a year, producing net benefits of $2.8 million a year (after disbenefits) over 30 years. At 7 %, which should be built?
Show solution
- X: PW of net benefits \(= 2.8 \times 12.409 = 34.75\); PW of costs \(= 20 + 0.4 \times 12.409 = 24.96\); \(B/C = 1.39\).
- Both are justified individually, and Y has the higher ratio.
- Increment X − Y: \(\Delta B = 34.75 - 23.58 = 11.17\); \(\Delta C = 24.96 - 15.72 = 9.24\); \(\Delta B/\Delta C = 1.21\).
- Because the incremental ratio exceeds 1, the extra spending on X is justified.
Answer: Build X, even though its overall B/C ratio is lower, because its additional benefits exceed its additional costs.
Distribution, equity and non-monetized effects
A benefit-cost ratio summarizes efficiency, not fairness. A project can have a high ratio while imposing costs on one community, such as residents displaced by a highway, and benefits on another, such as commuters from distant suburbs. Good practice includes distributional analysis, showing who gains and who loses by income group, region and other characteristics, and consultation with affected communities, including Indigenous communities whose rights and title may be affected. Many important effects, such as cultural heritage, biodiversity or community cohesion, are difficult to monetize credibly; they should be described and, where possible, quantified in physical terms rather than omitted. Multi-criteria analysis can complement BCA by scoring alternatives on several weighted criteria.
Strengths and criticisms
Benefit-cost analysis provides a transparent, systematic framework for comparing public investments, helps prevent projects with costs far exceeding benefits, and is required by many governments and funding programs. It is criticized for the difficulty of monetizing intangible effects, sensitivity to the discount rate and to contested values such as the value of a statistical life, the tendency of sponsors to overestimate benefits and underestimate costs, and its focus on efficiency rather than equity. Research on large infrastructure projects worldwide, notably by Bent Flyvbjerg and colleagues, has found systematic cost overruns and benefit shortfalls, partly due to optimism bias and strategic misrepresentation. Reference class forecasting, which adjusts estimates based on outcomes of similar past projects, is one response. Engineers contribute to better analyses by producing realistic estimates and honestly disclosing uncertainty.
Public-private partnerships and value for money
In a public-private partnership, a private consortium may design, build, finance, operate and maintain an asset such as a hospital or highway for 25 to 35 years in return for availability payments from the government. Value-for-money analysis compares the present worth of the partnership's payments with a public sector comparator, the estimated cost of delivering the same project conventionally, adjusted for risks transferred to the private partner, such as construction cost overruns and maintenance performance. The analysis is sensitive to the discount rate and to the valuation of transferred risk, and has been debated by auditors general in both countries. Engineers contribute by estimating life-cycle costs and the likelihood and cost of risks.
Cost-effectiveness analysis
When benefits cannot be monetized credibly but can be measured in physical units, cost-effectiveness analysis compares alternatives by their cost per unit of outcome, such as the cost per metric ton of carbon dioxide avoided, per collision prevented, or per cubic meter of water treated. It cannot say whether a project is worth doing at all, but it can identify which alternative achieves a goal at least cost. Marginal abatement cost curves, which rank emission reduction measures from cheapest to most expensive per metric ton, are a well-known application in energy and climate policy.
Engineers and public consultation
Benefit-cost results are often presented at public meetings, environmental assessments and council or legislative hearings. Engineers involved should explain the method, key assumptions and uncertainties in plain language, acknowledge effects that have not been monetized, and listen to concerns that may reveal costs or benefits the analysis missed. Transparent documentation, including the values used for time, safety and emissions, allows independent reviewers and the public to check the work.
Ex post evaluations of completed public projects, comparing actual costs and benefits with the original forecasts, are increasingly required by governments and help calibrate future analyses, much as post-audits do in private firms.
Common mistakes
MistakeCounting transfers such as taxes as benefits.
InsteadExclude transfers from societal benefit-cost analysis.
MistakeChoosing the alternative with the highest B/C ratio.
InsteadUse incremental B/C analysis.
MistakeUsing a private firm's MARR for public projects.
InsteadUse the social discount rate specified by the agency.
MistakeIgnoring non-monetized and distributional effects.
InsteadDescribe them and analyze who gains and loses.
MistakeAccepting optimistic sponsor estimates.
InsteadTest estimates against reference classes and sensitivity.
Summary and key terms
- Public projects are judged by benefits to society, not profit.
- BCA separates benefits, disbenefits and agency costs, excluding transfers.
- Non-market benefits are monetized with standard values such as time and risk reduction.
- The social discount rate is set by government guidance and strongly affects results.
- Projects are justified when B/C ≥ 1; conventional and modified ratios agree on acceptance.
- Mutually exclusive public alternatives require incremental B/C analysis.
- Distributional, equity and non-monetized effects must be considered alongside the ratio.
- Benefit-cost analysis
- Comparison of societal benefits with costs.
- Disbenefit
- Unfavorable effect on the public.
- Transfer
- Payment between groups with no net social value.
- Value of a statistical life
- Willingness to pay for small risk reductions, aggregated.
- Expected annual damage
- Probability-weighted annual hazard losses.
- Social discount rate
- Discount rate for public projects.
- Conventional B/C ratio
- (B − D) divided by costs.
- Modified B/C ratio
- O&M costs subtracted from the numerator.
- Incremental B/C
- Ratio of incremental benefits to incremental costs.
- Optimism bias
- Tendency to underestimate costs and overestimate benefits.
Practice problems
Work each problem on paper first, then reveal the answer to check.
Name two ways public projects differ from private ones.
Show answer
Long lives, public benefits, non-market values, tax financing, equity goals.
What is a disbenefit?
Show answer
An unfavorable effect on the public.
Why exclude taxes from societal BCA?
Show answer
They are transfers.
How are travel time savings valued?
Show answer
Hours saved times a value of time.
Expected annual damage with a 2 % chance of $5 million and 10 % chance of $1 million?
Show answer
$200,000.
Effect of a lower discount rate on long-lived projects?
Show answer
Raises their benefit-cost ratios.
B/C of PW benefits $30 million, disbenefits $2 million, costs $20 million?
Show answer
1.4.
Do conventional and modified ratios ever disagree on acceptance?
Show answer
No.
Why use incremental B/C?
Show answer
Individual ratios can misrank mutually exclusive alternatives.
What is reference class forecasting?
Show answer
Adjusting estimates using outcomes of similar past projects.
Lesson quiz · 5 questions
Score 60% or more to complete this lesson.
Create a free account to save your progress, take quizzes and earn a certificate.