
DCE-340 · Lesson 2 of 12 · 31 min
The utility supply and power quality
Backup power exists because the utility supply is imperfect. To design UPS, battery and generator systems sensibly, an engineer needs to know what the utility actually delivers: how a large data center is connected, how often the supply is interrupted and for how long, what voltage sags, harmonics and transients occur, and what the utility in turn expects of a large load. Lesson 1 introduced the ITIC curve and the disturbances a UPS protects against. This lesson looks at the supply side: service arrangements for data centers, reliability statistics, the causes and frequency of sags, power quality monitoring, the harmonics and other effects data centers impose on the grid, and the growing interconnection requirements for very large loads.
How data centers connect to the grid
The connection depends on size. A small enterprise data center may take a single low- or medium-voltage service like any commercial building. Large facilities, from a few megawatts to hundreds, connect at higher voltages and with redundancy:
- Single radial feed: one utility circuit; simplest and cheapest, but any fault or maintenance on it interrupts the supply, leaving everything to the backup systems.
- Dual feeds from one substation: two circuits from different transformers or bus sections, with automatic transfer between them.
- Dual feeds from separate substations: protects against the loss of a whole substation; often required by hyperscale operators.
- Dedicated on-site substation: campuses of 100 MW or more take service at transmission voltages (69 kV to 500 kV) into their own substation, with multiple transformers and lines.
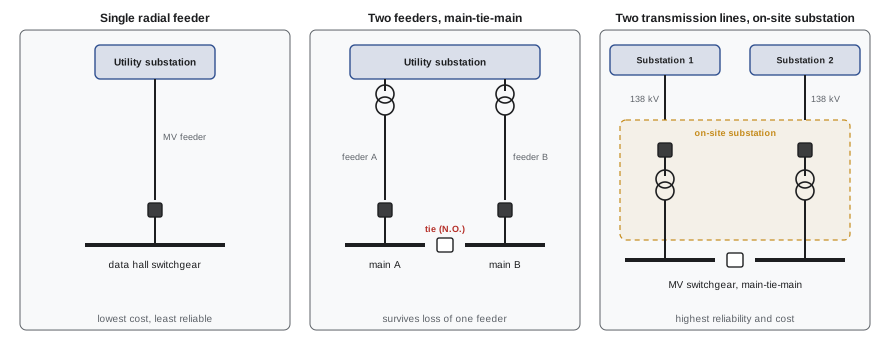
Even dual feeds share some common elements (the regional transmission grid, rights-of-way, weather) and do not remove the need for on-site backup. They do reduce how often the backup must run, and they allow maintenance on one feed without relying on generators.
Worked problem
Main-tie-main
A data center has two 13.8 kV feeders, each supplying a bus through a main breaker, with a normally open tie breaker between the buses. Each feeder can carry the full 12 MW load. Describe what happens when feeder A trips.
Show solution
- Bus A loses voltage; its UPS systems carry their loads on battery.
- The automatic controls open main breaker A (to isolate the failed feeder) and close the tie, so feeder B supplies both buses, typically within a few seconds.
- UPS systems on bus A return to the utility and recharge their batteries; generators are not needed unless feeder B also fails.
Answer: An automatic main-tie-main transfer restores both buses from feeder B within seconds, with the UPS bridging the gap. Interlocks prevent the two feeders from being paralleled unless the utility permits it.
Reliability statistics
Utilities report reliability with standard indices (IEEE 1366):
- SAIFI (system average interruption frequency index): sustained interruptions per customer per year.
- SAIDI (system average interruption duration index): minutes of sustained interruption per customer per year.
- CAIDI (customer average interruption duration index): SAIDI/SAIFI, the average length of an interruption.
- MAIFI (momentary average interruption frequency index): momentary interruptions (typically under 1 to 5 minutes, depending on the definition) per customer per year.
Typical North American values are a SAIFI of about 1 to 1.5 and a SAIDI of about 100 to 250 minutes, excluding major storms, but values vary greatly between urban and rural systems and between utilities. A data center on a dedicated transmission connection usually sees far fewer interruptions than an average customer. Momentary interruptions and voltage sags, however, are much more frequent than sustained outages, and they are what the UPS handles daily.
Worked problem
What the statistics mean for backup power
A utility reports SAIFI = 1.2 and CAIDI = 110 minutes for the feeder serving a data center. How many generator runs and generator hours per year should the operator expect, before counting tests?
Show solution
- Sustained interruptions: about 1.2 per year.
- Average duration: 110 minutes, so about \(1.2 \times 110 = 132\) minutes, 2.2 hours per year.
Answer: About one or two generator runs per year and a couple of hours of operation, plus monthly tests. Most years the generators run far more in testing than in real outages, which is why testing practices and emissions permits matter (Lesson 5).
Voltage sags and momentary interruptions
A voltage sag (dip) is a short reduction in voltage, typically lasting from half a cycle to a few seconds, while a fault elsewhere on the system is cleared. When lightning, a tree or an animal causes a fault on one feeder, every customer connected to the same substation sees the voltage drop until the protection clears the fault, typically in 50 to 300 ms. Customers on the faulted feeder itself may also see a momentary interruption while an automatic recloser opens and recloses the line, often several times.
Sags vastly outnumber outages. A service may see a few dozen sags a year, most to 70% to 90% of nominal voltage, while experiencing only one or two sustained outages.
import numpy as np

# A year of recorded voltage events at a data centre service: (residual voltage %, duration in s)
rng = np.random.default_rng(5)
events = [(rng.uniform(55, 89), rng.choice([0.05, 0.08, 0.1, 0.15, 0.3])) for _ in range(28)]
events += [(rng.uniform(20, 50), rng.choice([0.05, 0.1, 0.2])) for _ in range(6)]
events += [(0.0, d) for d in (0.4, 1.2, 2.5)]                 # recloser operations
events += [(0.0, 3600.0)]                                     # one long outage

def itic_ok(v, d):
    # simplified lower part of the ITIC curve for undervoltage
    if d <= 0.02:
        return True                 # up to 20 ms of zero voltage is tolerated
    if d <= 0.5:
        return v >= 70
    if d <= 10:
        return v >= 80
    return v >= 90

inside = sum(itic_ok(v, d) for v, d in events)
print(f"events recorded: {len(events)}; within the ITIC tolerance: {inside}; would disturb unprotected IT: {len(events) - inside}")
for lo, hi in ((80, 90), (70, 80), (50, 70), (10, 50), (0, 10)):
    n = sum(lo <= v < hi or (hi == 10 and v == 0) for v, d in events)
    print(f"  residual {lo:2d}-{hi:2d}%: {n} events")
print("every event is carried by the UPS; only the long outage needs the generators")events recorded: 38; within the ITIC tolerance: 15; would disturb unprotected IT: 23 residual 80-90%: 7 events residual 70-80%: 8 events residual 50-70%: 13 events residual 10-50%: 6 events residual 0-10%: 4 events every event is carried by the UPS; only the long outage needs the generators
The design consequences follow directly. The UPS must ride through every event; the generators must start only when an outage lasts longer than a short delay (commonly a few seconds), so that they are not started for every sag and recloser operation; and the battery must handle repeated short discharges without wearing out (Lesson 3).
Harmonics and the data center's effect on the grid
A data center is not only a victim of power quality problems but also a source. UPS rectifiers, server power supplies, variable-speed drives for fans and pumps, and chillers draw non-sinusoidal currents, creating harmonic currents that flow back into the utility system and distort the voltage for other customers.
- Modern UPS systems use active (IGBT) rectifiers with input current distortion below about 3% to 5%, and server power supplies with active power factor correction draw near-sinusoidal current, so large modern facilities are much cleaner than older ones with six-pulse rectifiers.
- IEEE 519 sets limits on current distortion at the point of common coupling with the utility, scaled to the ratio of available short-circuit current to load current, and on voltage distortion (typically 5% total, 3% individual, for systems up to 69 kV).
- Harmonic filters (passive or active) are added where needed, for example on legacy UPS systems or large drive loads.
Worked problem
Checking against IEEE 519
At a 13.8 kV point of common coupling, the available short-circuit current is 20 kA and the data center's maximum demand current is 800 A. Its measured total demand distortion is 4.5%. For systems up to 69 kV, IEEE 519 limits total demand distortion to 5% for short-circuit ratios below 20, 8% for 20 to 50, 12% for 50 to 100 and 15% for 100 to 1,000. Does it comply?
Show solution
- Short-circuit ratio: \(20{,}000/800 = 25\), in the 20-to-50 band.
- Limit: 8%; measured 4.5%.
Answer: Yes, with margin. The weaker the supply (the lower the short-circuit ratio), the stricter the limit, so the same facility on a weak rural line could face a 5% limit.
Other effects on the grid include voltage changes when large blocks of load start or stop, low-frequency power oscillations from synchronized AI training loads (Lesson 12), and, in the worst case, the sudden loss of a large load when many facilities transfer to backup at once.
Large-load interconnection and ride-through
A single hyperscale campus can draw as much power as a city of several hundred thousand people. Grid operators have found that data centers can behave in ways that affect the grid itself. In July 2024, a fault on a transmission line in Virginia caused about 1,500 MW of data center load to transfer to on-site backup almost simultaneously, a sudden loss of load that the grid operator had to balance. Such events prompted grid operators and the North American Electric Reliability Corporation (NERC) to study large loads and to develop requirements for them.
Emerging practices include:
- Interconnection studies for large loads, similar to those for large generators, examining their response to faults and voltage disturbances.
- Ride-through settings: UPS and transfer equipment configured so that the facility stays connected through grid faults that are cleared normally, rather than transferring to backup at the first sag, while still protecting the IT load.
- Coordination with the grid operator on when the facility transfers back to the grid after an event, so that large blocks of load do not return all at once.
- Demand response and flexibility agreements, in which data centers reduce grid consumption (by shifting workloads or running generators or batteries) during grid emergencies (Lesson 6).
Transients and surges
Lightning, capacitor bank switching by the utility, and switching of large loads produce fast transients: microsecond-scale voltage spikes that can reach many times nominal voltage. Protection is layered: surge arresters at the utility interface and medium-voltage equipment, surge protective devices (SPDs) at the service entrance and distribution boards, and the inherent filtering of double-conversion UPS units. Good grounding and bonding (DCE-310) are essential, so that surges are diverted without creating voltage differences between equipment.
Power quality monitoring
Large facilities install power quality meters at the utility service, at major switchboards and at UPS inputs and outputs. Meters meeting IEC 61000-4-30 Class A record sags, swells, interruptions, harmonics, flicker, unbalance and transients with timestamps synchronized to GPS or network time, so that events can be correlated across the facility and with the utility's records. These data:
- Show whether problems originate on the utility side or inside the facility.
- Support discussions with the utility about reliability and with equipment vendors about ride-through.
- Verify compliance with harmonic limits and interconnection agreements.
- Provide evidence after incidents, such as whether a UPS transferred to battery correctly during a sag.
Worked problem
Diagnosing nuisance transfers
A data center's UPS systems transfer to battery several times a month, each time for less than a second, while the utility reports no outages. Power quality records show sags to 85% lasting 80 ms at those times. What is happening, and what could be done?
Show solution
- The sags are shallow and short: within the ITIC curve, they would not disturb IT equipment directly.
- The UPS input tolerance is set narrowly, so it transfers to battery for each sag; each transfer is a battery discharge cycle.
Answer: The UPS input window is tighter than necessary. Widening it within the manufacturer's limits (or, for double-conversion units, allowing the rectifier to ride through shallow sags) reduces battery cycling and nuisance alarms without reducing protection.
Common mistakes
MistakeAssuming dual utility feeds remove the need for on-site backup.
InsteadDual feeds reduce interruptions but share common risks; keep UPS and generators.
MistakeStarting generators for every sag or recloser operation.
InsteadDelay generator starts by a few seconds; let the UPS carry short events.
MistakeIgnoring the facility's own harmonics.
InsteadCheck current distortion against IEEE 519 at the point of common coupling.
MistakeSetting UPS input tolerances as narrowly as possible.
InsteadSet them to ride through shallow sags that IT equipment tolerates, reducing battery cycling.
MistakeTreating a large campus as an ordinary customer.
InsteadCoordinate ride-through, transfer and return-to-grid behavior with the grid operator.
Summary and key terms
- Data centers connect by radial, dual-feed or on-site substation arrangements, depending on size.
- SAIFI, SAIDI, CAIDI and MAIFI describe utility reliability; sags far outnumber outages.
- The UPS rides through sags and short interruptions; generators start only after a delay.
- Data centers create harmonics, limited by IEEE 519 at the point of common coupling.
- Very large loads affect the grid; ride-through and interconnection requirements are emerging.
- Layered surge protection and Class A power quality monitoring complete the picture.
- Radial feed
- A single utility circuit supplying a facility.
- Main-tie-main
- Two mains and a tie breaker allowing either source to supply both buses.
- SAIFI
- Average sustained interruptions per customer per year.
- SAIDI
- Average minutes of sustained interruption per customer per year.
- Voltage sag
- A short reduction in voltage, usually during a fault elsewhere.
- Recloser
- A device that opens and recloses a line automatically after a fault.
- Point of common coupling
- Where a customer's system connects to the utility for power quality limits.
- Total demand distortion
- Harmonic current relative to the maximum demand current.
- Ride-through
- Staying connected and operating through a disturbance.
- Class A meter
- A power quality instrument meeting IEC 61000-4-30 Class A accuracy.
Practice problems
Work each problem on paper first, then reveal the answer to check.
What advantage do feeds from separate substations add over dual feeds from one?
Show answer
Protection against the loss of a whole substation.
CAIDI if SAIDI = 150 min and SAIFI = 1.5?
Show answer
100 minutes.
Why are sags more common than outages for a data center?
Show answer
Faults on any nearby feeder cause sags; only faults on its own supply cause outages.
How long does a typical sag last?
Show answer
From about half a cycle to a few hundred milliseconds.
Why delay generator starts by a few seconds?
Show answer
To avoid starting for sags and recloser operations the UPS can carry.
Short-circuit ratio for 30 kA available and 1,000 A demand?
Show answer
30.
Typical input current distortion of a modern active-rectifier UPS?
Show answer
Below about 3–5%.
What happened in Virginia in July 2024?
Show answer
About 1,500 MW of data center load transferred to backup after a line fault.
What does a Class A power quality meter provide?
Show answer
Standardized, time-synchronized measurements of sags, harmonics and other events.
Why widen a UPS input tolerance window?
Show answer
To avoid needless battery transfers on shallow sags.
Lesson quiz · 5 questions
Score 60% or more to complete this lesson.
Create a free account to save your progress, take quizzes and earn a certificate.