
CSCO-112 · Lesson 9 of 12 · 17 min
Diagnostic commands: ping, traceroute, show
▶ Video coming soon A video version of this lesson is on the way.
Dev keeps a laminated card taped inside the lid of his laptop. It lists about a dozen commands, half for Windows and macOS, half for Cisco devices, and beside each one a single question it answers: Am I connected? What address do I have? Can I reach the gateway? Where does the path stop? Is the port up? Is it dropping errors? "You don't need a hundred commands," he tells Jordan. "You need to know which question each of these answers, and to read the answer properly." This lesson works through that card.
Checking the host first
Most network troubleshooting starts on the device that has the problem. The first question is whether it has a sensible address. On Windows, ipconfig shows each adapter's IPv4 and IPv6 addresses, subnet mask and default gateway, and ipconfig /all adds the MAC address, DHCP server, lease times and DNS servers. On macOS and Linux, ip addr (or the older ifconfig) shows addresses, ip route shows the default gateway, and the DNS servers appear in the network settings or in the resolver configuration.
Reading the output is the skill. An address in 169.254.0.0/16 means DHCP failed, as lesson 5 explained. An address in the wrong subnet suggests the wrong VLAN. A missing default gateway, or one outside the host's subnet, explains why local resources work and nothing else does. A DNS server the host cannot reach explains why names fail.
C:\> ipconfig
Ethernet adapter Ethernet:
   Connection-specific DNS Suffix  . : prairiepaws.local
   IPv4 Address. . . . . . . . . . . : 10.20.10.37
   Subnet Mask . . . . . . . . . . . : 255.255.255.0
   Default Gateway . . . . . . . . . : 10.20.10.1

Linux or macOS:
ip addr show
ip route show
  default via 10.20.10.1 dev eth0
ping
ping sends ICMP echo request messages to a destination and reports the echo replies. It answers the most basic question in networking: can these two devices reach each other at layer 3, and how long does the round trip take? Windows sends four requests by default; macOS and Linux keep sending until stopped with Ctrl+C unless given a count with -c. Each reply shows the round-trip time in milliseconds and the TTL of the reply.
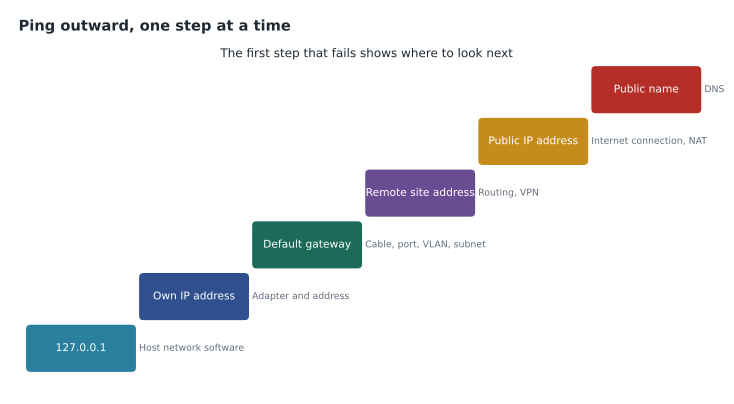
Technicians use ping in a sequence that moves outward from the host, so that the first failure points to where the problem lies. First ping 127.0.0.1, the loopback address, to confirm the host's own network software works. Then ping the host's own address, then the default gateway, then a device beyond the gateway such as a server at another site, then a public address such as 8.8.8.8, and finally a public name such as cisco.com to test DNS as well. If the gateway answers but nothing beyond it does, the problem is upstream of the local network.
C:\> ping 10.20.10.1

Pinging 10.20.10.1 with 32 bytes of data:
Reply from 10.20.10.1: bytes=32 time=1ms TTL=255
Reply from 10.20.10.1: bytes=32 time<1ms TTL=255
Reply from 10.20.10.1: bytes=32 time<1ms TTL=255
Reply from 10.20.10.1: bytes=32 time=1ms TTL=255

C:\> ping 10.20.10.200
Pinging 10.20.10.200 with 32 bytes of data:
Request timed out.
Request timed out.
Ping's messages need careful reading. Request timed out means no reply came back in time; the target may be down, the path may be broken, or a firewall may be blocking ICMP. Destination host unreachable usually means a router, or the host itself, could not find a way to deliver the packet, for example because ARP for a local address got no answer. TTL expired in transit points to a routing loop. A successful ping does not prove an application works, and a failed ping does not prove a device is down, because many firewalls, including the Windows firewall by default on some networks, block ICMP echo.
On a Cisco device, ping shows each reply as a single character: an exclamation mark for a reply, a dot for a timeout and U for unreachable. Five exclamation marks mean all five replies arrived. The first attempt from a router often shows a dot followed by four exclamation marks, because the first packet was dropped while the router used ARP to find the next hop's MAC address; that is normal.
traceroute
traceroute (tracert on Windows) shows the path packets take to a destination, one router at a time. It works by sending packets with a TTL of 1, then 2, then 3 and so on. Each router along the path decrements the TTL, and the router where it reaches zero sends back an ICMP time-exceeded message, revealing its address. The tool lists each hop with three round-trip times. When the destination answers, the trace is complete.
Traceroute is used to find where a path stops or slows. If hops 1 to 4 answer and everything after hop 4 times out, the problem lies at or after hop 4. A sudden jump in times at one hop that continues to the destination suggests a slow link at that point. Some routers do not answer traceroute probes and show asterisks while the path beyond them works normally, so a line of asterisks in the middle of a trace that then continues is not a fault.
C:\> tracert portal.riversidefamilylaw.com

Tracing route to portal.riversidefamilylaw.com [198.51.100.20]
over a maximum of 30 hops:
  1    <1 ms    <1 ms    <1 ms  192.168.1.1
  2     8 ms     7 ms     8 ms  10.88.0.1
  3    11 ms    10 ms    12 ms  203.0.113.65
  4     *        *        *     Request timed out.
  5    24 ms    23 ms    25 ms  198.51.100.1
  6    25 ms    24 ms    24 ms  198.51.100.20
Trace complete.
Name and address tools
nslookup queries DNS directly, as lesson 5 showed, and can ask a particular server by adding its address: nslookup portal.riversidefamilylaw.com 8.8.8.8. On Linux and macOS, dig gives more detail. arp -a lists the host's ARP cache, the IP-to-MAC mappings it has learned; if the gateway's entry is missing or shows an unexpected MAC address, there is a layer 2 problem or possibly a spoofing attempt. netstat (and on newer Windows versions, Get-NetTCPConnection in PowerShell) lists active connections and listening ports, which shows whether an application is actually connected to its server. tracert, pathping on Windows and mtr on Linux combine tracing with repeated pings to show loss at each hop.
| Tool | Platforms | Question it answers |
|---|---|---|
| ipconfig / ip addr | Windows / Linux, macOS | What address, mask, gateway and DNS do I have? |
| ping | All | Can I reach this address, and how quickly? |
| tracert / traceroute | Windows / Linux, macOS, Cisco | Which routers are on the path, and where does it stop? |
| nslookup / dig | All / Linux, macOS | What does DNS say about this name? |
| arp -a | All | Which MAC addresses has this host learned for local IP addresses? |
| netstat | All | Which connections and listening ports are open? |
| iperf3 | All (installed separately) | How much throughput can this path carry? |
Show commands on Cisco devices
On switches and routers, the show commands from lesson 2 become diagnostic tools. show ip interface brief is usually the first. It lists each interface with its IP address and two status columns. Status describes layer 1 and Protocol describes layer 2. Up and up means the interface is working. Down and down means no link: an unplugged cable, a device that is off or a broken cable. Administratively down means someone has shut the interface down with the shutdown command. Up and down usually means a layer 2 problem, such as mismatched encapsulation on a serial link or a failed keepalive.
R-PP1# show ip interface brief
Interface              IP-Address      OK? Method Status                Protocol
GigabitEthernet0/0     203.0.113.10    YES NVRAM  up                    up
GigabitEthernet0/1     unassigned      YES unset  up                    up
GigabitEthernet0/1.10  10.20.10.1      YES NVRAM  up                    up
GigabitEthernet0/1.30  10.20.30.1      YES NVRAM  up                    up
GigabitEthernet0/2     unassigned      YES unset  administratively down down
Tunnel1 10.255.0.1 YES NVRAM up up| Status | Protocol | Meaning | Typical cause |
|---|---|---|---|
| up | up | Working | Nothing wrong at layers 1 and 2 |
| down | down | No physical link | Unplugged or faulty cable, device off, wrong port |
| administratively down | down | Disabled by configuration | The shutdown command |
| up | down | Link present but layer 2 failing | Encapsulation mismatch, keepalive or other data link problem |
show interfaces gives the detail behind each line: speed and duplex, input and output rates, and the error counters. Rising CRC errors and input errors usually mean a damaged cable, a bad connector or interference. Late collisions on a modern full-duplex link point to a duplex mismatch, where one end runs full duplex and the other half duplex, which makes a link work but painfully slowly. Output drops mean the interface is congested. Counters accumulate since the last reload or clear, so the useful question is whether they are still rising: clear counters, wait, and look again.
On switches, show interfaces status shows each port's VLAN, speed, duplex and state in one line; show vlan brief shows which ports are in which VLAN; show mac address-table shows where a device was last seen; and show interfaces trunk lists trunks, their native VLAN and their allowed VLANs. show cdp neighbors lists directly connected Cisco devices with the local and remote port names, which is often the fastest way to find out what is at the other end of a cable. LLDP, the open-standard equivalent, does the same for other vendors' equipment with show lldp neighbors.
SW-PP1# show cdp neighbors
Device ID        Local Intrfce     Holdtme    Capability  Platform     Port ID
R-PP1            Gig 1/0/24        151            R S I   ISR4321      Gig 0/1
AP-Reception     Gig 1/0/22        128            T B I   C9120AXI     Gig 0

SW-PP1# show interfaces gigabitEthernet1/0/9 | include duplex|errors|CRC
  Half-duplex, 100Mb/s, media type is 10/100/1000BaseTX
     2 input errors, 2 CRC, 0 frame, 0 overrun, 0 ignored
     0 output errors, 0 collisions, 0 interface resets
     41 late collision, 0 deferred
Other tools
Two more tools appear in the CCST objectives. iperf3 measures throughput between two computers by running a server on one and a client on the other; it shows whether a link really delivers the speed the provider promised. Wireshark captures packets and decodes them, so a technician can watch a DHCP exchange, a TCP three-way handshake (SYN, SYN-ACK, ACK) or a failing DNS query happen. Capturing traffic can reveal private information, so it should be done only with permission and only on networks the technician is responsible for. Link and activity LEDs on switch ports are a quick physical check: no light means no link, and many switches use amber or blinking patterns to show errors, blocked spanning-tree ports or PoE faults, as described in the hardware guide.
Common mistakes
MistakeDeciding a server is down because it does not answer ping.
InsteadMany firewalls block ICMP; test the actual service, such as a web page or port.
MistakeTreating asterisks in the middle of a traceroute as the fault.
InsteadIf later hops answer, the silent router is just not replying to probes.
MistakeReading error counters once and drawing conclusions.
InsteadClear the counters, wait, and check whether errors are still increasing.
MistakeIgnoring the difference between down and administratively down.
InsteadAdministratively down means it was shut down on purpose; check the configuration before replacing a cable.
Worked problem
Ping step by step
A Prairie Paws reception PC cannot reach the internet. Jordan finds: ping 127.0.0.1 succeeds, ping 10.20.10.37 (its own address) succeeds, ping 10.20.10.1 (the gateway) succeeds, ping 8.8.8.8 times out. What does this tell him, and what should he check next?
Show solution
- The host's network software and its own address work.
- The PC can reach its gateway, so the local cable, port, VLAN and address are fine.
- Traffic stops beyond the gateway, so the problem is at the router, the firewall or the internet connection, not the PC.
Answer: Check the router: show ip interface brief for the internet interface, show ip route for a default route, and whether other PCs have the same problem.
Summary and key terms
- Diagnostics start on the host with ipconfig or ip addr to check the address, mask, gateway and DNS. ping tests reachability step by step from loopback to the gateway to remote addresses and names; timeouts, unreachable messages and blocked ICMP need careful reading. traceroute lists the hops on a path using TTL expiry and shows where it stops. nslookup, arp -a and netstat answer name, layer 2 and connection questions.
- On Cisco devices, show ip interface brief gives status and protocol, show interfaces reveals errors and duplex mismatches, and CDP or LLDP identify neighbors. iperf3 measures throughput and Wireshark shows the packets themselves.
- ping
- A tool that sends ICMP echo requests and reports replies and round-trip times.
- traceroute
- A tool that lists the routers on a path by sending packets with increasing TTL values.
- Hop
- One router along a path.
- administratively down
- An interface status meaning it has been disabled with shutdown.
- CRC error
- A frame that arrived damaged, often due to cabling problems.
- Duplex mismatch
- One end of a link in full duplex and the other in half duplex.
- CDP
- Cisco Discovery Protocol, which identifies directly connected Cisco devices.
- iperf3
- A tool that measures network throughput between two hosts.
Practice problems
Work each problem on paper first, then reveal the answer to check.
What does an exclamation mark mean in Cisco ping output?
Show answer
A reply was received.
An interface shows down/down. Name two likely causes.
Show answer
An unplugged or faulty cable, or the device at the other end being off.
How does traceroute discover each router on the path?
Show answer
It sends packets with increasing TTL values; each router where the TTL expires replies with an ICMP time-exceeded message.
Lesson quiz · 5 questions
Score 60% or more to complete this lesson.
Create a free account to save your progress, take quizzes and earn a certificate.