
CRE-301 · Lesson 12 of 12 · 27 min
Measuring community health and planning for growth
Growth in followers and members is easy to count, but it does not show whether a community is healthy. A server with 20,000 members can be a ghost town, while a forum of 800 can be a vibrant, supportive place where people return daily. Measuring community health means looking at activity, engagement, retention, contribution, responsiveness, safety and sentiment together, and combining numbers with listening. This lesson introduces key community health metrics, explains how to calculate and interpret them, shows how to use surveys and qualitative signals, sets out a regular review routine, and brings the course together in a capstone plan for growing an audience into a community.
Why health beats size
Healthy communities sustain themselves: members return, help each other, welcome newcomers and create value without constant intervention. Unhealthy communities may grow quickly through promotion but then decline as members drift away, conflicts flare or a few voices dominate. Size matters for reach and revenue, but health predicts whether the community will still exist in two years. The goal of measurement is to notice problems early, understand what helps and make better decisions, not to optimize a single number. Goodhart's law warns that when a measure becomes a target, it ceases to be a good measure: pushing members to post more, for example, can create noise rather than meaningful participation.
Activity and stickiness
Active members are those who visit or participate within a period. Platforms report daily, weekly and monthly active users or members (DAU, WAU and MAU). The ratio of daily to monthly active members, often called stickiness, shows how often active members return:
A stickiness of 20 % means the average active member visits on about six days a month. Interpret stickiness in light of the community's rhythm: a daily chat community should be stickier than a monthly book club or a forum that members consult when they need help. Also track the active share of total members, since many members join and never return.
Worked problem
Comparing two months
In March, a server had 12,000 members, 2,400 monthly active members and an average of 360 daily active members. In April, after a promotional collaboration, it had 15,000 members, 3,000 monthly active members and 390 daily active members. Calculate the active share and stickiness for each month and interpret them.
Show solution
- March active share: 2,400 / 12,000 = 20 %; stickiness: 360 / 2,400 = 15 %.
- April active share: 3,000 / 15,000 = 20 %; stickiness: 390 / 3,000 = 13 %.
- Active members rose 25 %, but daily activity rose only about 8 %.
- New members are active at a similar rate but visit less often; onboarding may need work to turn them into regulars.
Answer: Active share held at 20 %, but stickiness fell from 15 % to 13 %, suggesting that new arrivals are not yet forming habits.
Engagement and contribution
Activity counts visits; engagement measures what members do. Useful measures include posts and replies per active member, the contributor ratio (Lesson 9), the share of posts that receive a reply, the share of new members who post in their first week, and the number of member-led events or projects. The distribution matters: if 10 members write half of all posts, the community depends heavily on them and may feel closed to others. A simple concentration check is the share of posts written by the top 1 % or 10 % of contributors. Rising contribution from a broader base is a strong sign of health.
| Metric | What it shows | Warning sign |
|---|---|---|
| Active share | Members who participate at all | Steady fall as membership grows |
| Stickiness (DAU/MAU) | How often active members return | Falling after promotions |
| Contributor ratio | Breadth of participation | Few members write most posts |
| First-week posting rate | Onboarding effectiveness | Most newcomers never post |
| Reply rate | Responsiveness to members | Many posts with no reply |
| Cohort retention | Whether members stay | Steep drop after month one |
| Moderation reports | Safety and conflict | Rising reports per active member |
| Sentiment and survey scores | How members feel | Falling sense of belonging |
Responsiveness
Members stay when they feel heard. Responsiveness measures include the share of questions or introductions that receive a reply and the median time to first reply. In help-focused communities, the share of questions marked as answered matters. Responsiveness should come increasingly from members rather than only the creator or moderators, which shows that the community is becoming member-centered. Median time is better than average time, because a few unanswered posts can distort an average.
Worked problem
Reply rate and median response time
In a week, 50 new questions were posted in a help forum. Forty received a reply. The times to first reply, in hours, for the 40 answered questions had a median of 3.5 hours, while the average was 9 hours. Members wrote 30 of the first replies and moderators 10. Interpret these figures.
Show solution
- Reply rate: 40 / 50 = 80 %, so 1 question in 5 went unanswered.
- The median of 3.5 hours means half of answered questions received a reply within 3.5 hours; the higher average reflects a few slow replies.
- Member share of first replies: 30 / 40 = 75 %, a good sign of member-centered support.
Answer: Responsiveness is good overall, but the 20 % unanswered rate is worth addressing, for example with a weekly sweep of unanswered posts or a helper role.
Retention cohorts
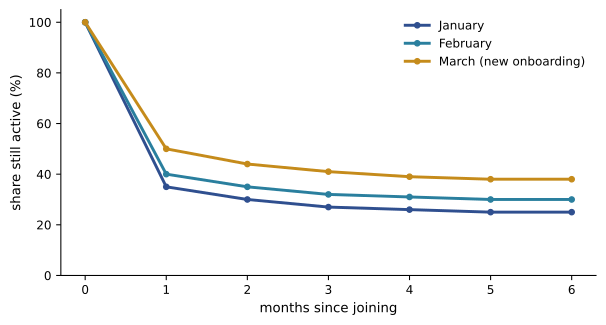
Cohort analysis (Lesson 2) shows what share of members who joined in a given month are still active after one, three or six months. Comparing cohorts reveals whether changes to onboarding, rituals or moderation improve retention, and whether members from particular sources, such as a collaboration or a paid promotion, stay. For paid memberships, track monthly churn and the share of members who renew annual plans. Retention curves that flatten after an initial drop indicate a core of committed members; curves that keep falling suggest the community is not delivering lasting value.
Safety and sentiment
Health also depends on whether members feel safe and valued. Track moderation reports per active member, response times to serious reports, repeat offender rates and appeal outcomes (Lesson 10). Measure sentiment through regular member surveys, asking questions such as "How likely are you to recommend this community to a friend?", "I feel I belong here" on an agreement scale, and open questions about what members value and what they would change. Sense-of-community scales based on McMillan and Chavis's four elements (Lesson 1) can be adapted. Keep surveys short, explain how results will be used, protect respondents' privacy and report back on what you change.
The Net Promoter Score (NPS) above is widely used but crude; use it alongside open comments, and look at trends over time rather than single readings.
Listening beyond the numbers
Numbers miss much of what matters. Qualitative signals include the tone of conversations, whether newcomers are welcomed, inside jokes and traditions, stories members tell about how the community helped them, and the topics that generate the most thoughtful discussion. Talk to members directly through small listening sessions or one-on-one conversations, especially with quieter members and people who left. Moderators often notice changes before metrics do, so include them in reviews. When numbers and stories disagree, investigate rather than trusting either automatically.
A regular review routine
A sustainable measurement routine might include a short weekly check of activity, unanswered posts and moderation issues; a monthly review of active members, stickiness, contribution, first-week posting and cohort retention; a quarterly survey and review of goals, rituals and structure with moderators; and an annual reflection on purpose, growth and direction. Keep a simple dashboard, ideally in a spreadsheet, with consistent definitions so that comparisons are meaningful. Note events, such as collaborations, platform changes or conflicts, alongside the numbers, so that later reviews can explain changes.
Capstone: an audience-to-community growth plan
The course ends with a plan that brings the lessons together. For your own channel or a realistic case, prepare a growth and community plan that includes:
- Audience and purpose: who you serve, what your community is for and how it differs from your audience (Lessons 1 and 9).
- Growth model: your current growth, retention and churn estimates, a steady-state projection and the levers you will pull (Lesson 2).
- Durable growth strategies: evergreen content, series, search and any contests or paid promotion, with legal checks (Lesson 3).
- Collaboration plan: three potential partners, estimated overlap and proposed formats (Lesson 4).
- Platform mix: primary platform, secondary platforms and a repurposing workflow (Lesson 5).
- Owned channels: website, domain, link page and email strategy, including consent, compliance and a welcome sequence (Lessons 6 and 7).
- Community space: chosen platform, structure, membership offer if any, fees and privacy approach (Lesson 8).
- Design: guidelines, onboarding, rituals and roles (Lesson 9).
- Moderation: layers, enforcement ladder, moderator team and escalation guide (Lesson 10).
- Criticism and conflict: response principles, accountability process and well-being boundaries (Lesson 11).
- Health metrics: a dashboard with five to eight metrics, targets and a review routine (Lesson 12).
A good plan is realistic about time and resources, focuses on a few priorities each quarter and includes ways to learn from results.
Building a simple dashboard
A community dashboard need not be elaborate. A spreadsheet with one row per week or month and columns for total members, active members, daily active average, posts, contributors, first-week posting rate, reply rate, median response time, moderation reports and notable events is enough for most creators. Calculated columns can show active share, stickiness and contributor ratio automatically. Charts of these columns over time make trends visible. Most community platforms provide some of these figures in their insights pages; others can be counted with bots or exported data. Define each metric clearly, for example what counts as an active member, and keep definitions stable so that comparisons remain meaningful.
Setting targets wisely
Targets help focus effort, but they should be realistic, few and connected to purpose. Rather than "double the server size", a target might be "raise the share of new members who post in their first week from 15 % to 25 % this quarter" or "reduce the share of unanswered questions to under 10 %". Each target should come with a plan, such as improving welcome messages or creating a helper role, and a way to tell whether the plan worked. Review targets quarterly and retire those that no longer serve the community.
Ethics of measurement
Measuring members' behavior raises ethical questions. Use aggregated data rather than tracking individuals where possible, tell members what you measure and why, avoid reading private messages, and comply with privacy laws (Lesson 8). Do not use metrics to rank or shame members, or to reward behavior that harms the community, such as provocative posts that generate replies. The purpose of measurement is to serve members better, and members should be able to see that.
When metrics disagree
Different metrics sometimes point in different directions. Member counts may rise while stickiness falls, or posts may increase while survey scores decline. Treat disagreements as questions to investigate. A rise in posts with falling satisfaction might mean a heated conflict or a wave of spam; rising members with falling active share might reflect a promotion that attracted casual visitors. Look at the raw activity, talk to moderators and members, and check whether definitions or platform reporting changed.
Benchmarks and comparisons
Creators often ask what good numbers look like. Published benchmarks vary widely by platform, niche and community type, so use them only as rough guides. A daily chat community might see stickiness of 20 % or more, while a forum consulted for help might see 5 % to 10 % and still be healthy. A first-week posting rate of 20 % to 30 % suggests strong onboarding in many communities, but a large server that attracts casual visitors through promotions may see much lower rates. The most useful comparison is with your own community over time: are activity, contribution, responsiveness, retention and sentiment improving after the changes you have made? Keep notes on what you changed and when, so that later trends can be linked to specific decisions.
Common mistakes
MistakeJudging a community by member count alone.
InsteadMeasure activity, contribution, retention, safety and sentiment.
MistakeTurning one metric into a target.
InsteadUse several metrics and remember Goodhart's law.
MistakeUsing average response time.
InsteadUse median time and reply rate.
MistakeRelying only on numbers.
InsteadCombine metrics with listening and moderator insight.
MistakeMeasuring without consistent definitions.
InsteadKeep a dashboard with stable definitions and notes on events.
Summary and key terms
- Health predicts a community's future better than size.
- Stickiness (DAU/MAU) shows how often active members return.
- Contributor ratio and concentration show the breadth of participation.
- Reply rate and median time measure responsiveness.
- Cohort retention reveals whether members stay.
- Surveys and listening capture belonging and safety.
- A regular review routine and capstone plan turn measurement into action.
- Active member
- Member who visits or participates in a period.
- DAU and MAU
- Daily and monthly active users or members.
- Stickiness
- Ratio of daily to monthly active members.
- Active share
- Share of total members who are active.
- Concentration
- Share of activity from top contributors.
- Reply rate
- Share of posts that receive a reply.
- Median response time
- Middle value of times to first reply.
- Net Promoter Score
- Share of promoters minus share of detractors.
- Goodhart's law
- A measure used as a target stops being a good measure.
- Community health
- Overall well-being of a community across several measures.
Practice problems
Work each problem on paper first, then reveal the answer to check.
Why does health matter more than size?
Show answer
It predicts whether the community will sustain itself.
Stickiness for 500 DAU and 4,000 MAU?
Show answer
12.5 %.
Active share for 1,800 active of 9,000 members?
Show answer
20 %.
What does a high concentration of posts suggest?
Show answer
Dependence on a few members and possible exclusion of others.
Why use median response time?
Show answer
A few slow replies distort the average.
Reply rate for 72 of 90 questions answered?
Show answer
80 %.
What does a flattening retention curve indicate?
Show answer
A committed core of members.
NPS with 50 % promoters and 20 % detractors?
Show answer
+30.
Name two qualitative signals of health.
Show answer
Welcoming tone, traditions, member stories, thoughtful discussion.
What should a monthly review cover?
Show answer
Active members, stickiness, contribution, first-week posting, retention.
Lesson quiz · 5 questions
Score 60% or more to complete this lesson.
Create a free account to save your progress, take quizzes and earn a certificate.