
CON-260 · Lesson 9 of 12 · 31 min
Data, dashboards and analytics
Every digital tool on a project produces data: model versions, RFIs, submittals, daily logs, inspections, timesheets, deliveries, costs, sensor readings and photos. Most of it is never analyzed. Used well, these data can show a project team early that a job is drifting, help executives compare projects fairly and help a firm learn what actually drives cost, schedule and safety performance. Used badly, they produce cluttered dashboards that nobody trusts. This lesson covers the foundations: data sources and quality, key performance indicators, earned value and safety measures, dashboard design and the basics of analysis, with an honest look at what data can and cannot tell a construction manager.
Where construction data come from
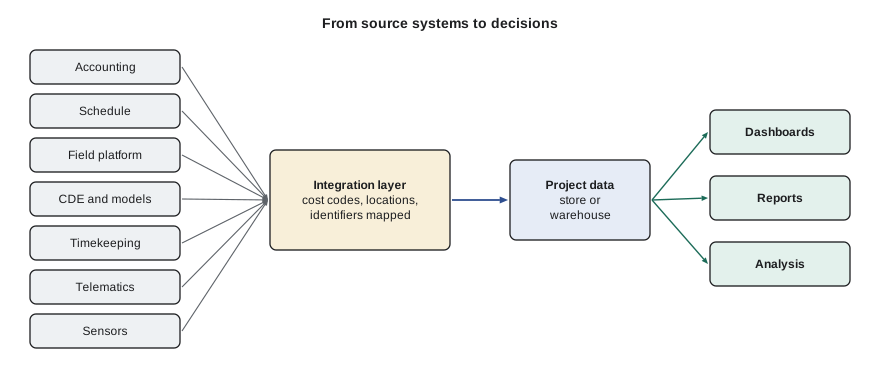
Construction data come from many systems, each designed for its own purpose. Accounting holds commitments, costs and payments. Scheduling holds activities, dates and progress. The field platform holds RFIs, submittals, logs, inspections and safety records (Lesson 7). The CDE holds models and documents (Lesson 4). Time and attendance systems hold hours by worker and cost code. Equipment telematics report engine hours, fuel and location (CON-250). Sensors report concrete temperature, humidity, vibration or noise. Reality capture provides progress measurements (Lesson 8).
The difficulty is that these systems rarely share identifiers. A cost code in accounting, an activity ID in the schedule, a location in the field platform and a zone in the model may all describe the same work in different ways. Connecting them requires a common data structure: standard cost codes, a location breakdown that is the same in the model, schedule and field platform, and consistent project and vendor identifiers. Without it, analysis is mostly manual reconciliation.
Data quality
Analysis is only as good as the data. Common data-quality problems in construction include missing values (daily logs not completed), inconsistent coding (the same work charged to different cost codes on different jobs), late entry (costs posted weeks after they are incurred), duplicates, and free-text fields that cannot be analyzed. Improving data quality is mostly about process: making the right data easy to enter at the source, validating entries automatically, and showing people that the data are used.
| Dimension | Question | Construction example |
|---|---|---|
| Completeness | Are all required values present? | Daily logs missing for 6 of 22 working days |
| Accuracy | Do values reflect reality? | Manpower counts copied from the previous day |
| Consistency | Are the same things coded the same way? | Rebar charged to three different cost codes |
| Timeliness | Are data entered when they occur? | Subcontractor costs posted 6 weeks late |
| Uniqueness | Is each record recorded once? | Duplicate RFIs for the same question |
Worked problem
Measuring daily-log completeness
Across a portfolio of eight active projects, 176 working days elapsed last month (22 per project). Daily logs were submitted for 151 project-days; of those, 128 included manpower by trade and 97 included at least one photo. What are the completeness rates, and what do they suggest?
Show solution
- Log submission completeness = 151 ÷ 176 ≈ 86 %.
- Manpower completeness (of all days) = 128 ÷ 176 ≈ 73 %.
- Photo completeness (of all days) = 97 ÷ 176 ≈ 55 %.
- Any analysis of labor productivity from these logs would be missing more than a quarter of the data.
Answer: Logs are mostly submitted, but manpower and photos are often missing. Fix the process (required fields, simple mobile entry, weekly review) before building productivity dashboards on these data.
Key performance indicators
A key performance indicator (KPI) is a measure chosen because it reflects progress toward an important goal. Good KPIs are few, clearly defined, measured the same way across projects, linked to decisions and balanced between leading indicators (which predict outcomes, such as RFI turnaround or near-miss reporting) and lagging indicators (which record outcomes, such as cost overrun or recordable injuries).
| Area | Leading indicator | Lagging indicator |
|---|---|---|
| Cost | Committed cost vs budget; change events pending | Cost performance index; final margin |
| Schedule | Activities started on time; constraint removal rate | Schedule performance index; milestone variance |
| Quality | First-time inspection pass rate | Rework cost; warranty claims |
| Safety | Observations and near misses reported; training completed | Recordable and lost-time injury rates |
| Design and information | RFI turnaround; submittal cycle time | Change orders from design issues |
| Productivity | Percent plan complete (weekly commitments met) | Labor hours per unit installed vs estimate |
Percent plan complete (PPC), from the Last Planner System, is a useful leading indicator: the share of weekly work commitments that were completed as promised. Low PPC means the plan is unreliable, which tends to precede schedule slippage.
Earned value
Earned value management (EVM) combines cost and schedule into a consistent set of measures. It compares three quantities at a status date: planned value (PV), the budgeted cost of work scheduled to date; earned value (EV), the budgeted cost of work actually completed; and actual cost (AC), what the completed work actually cost. From these come variances and indices.
An SPI below 1 means less work has been done than planned; a CPI below 1 means the work done has cost more than budgeted. The estimate at completion (EAC) shown here assumes that the cost performance to date will continue; other formulas exist for different assumptions. Because a 5D model linked to the schedule (Lesson 6) produces planned value automatically, and reality capture or field progress produces percent complete, EVM is easier to run in a digital workflow than it used to be.
# Earned value for four work packages at a status date (all figures in $)
packages = {
    #  name          budget (BAC)  planned %  earned %  actual cost
    "Structure":     (3_600_000,     1.00,      0.95,    3_610_000),
    "Envelope":      (2_400_000,     0.60,      0.45,    1_150_000),
    "MEP rough-in":  (3_000_000,     0.50,      0.52,    1_480_000),
    "Interiors":     (2_800_000,     0.10,      0.05,      160_000),
}
PV = EV = AC = BAC = 0
for name, (bac, pl, ea, ac) in packages.items():
    pv, ev = bac * pl, bac * ea
    print(f"{name:13s} SPI {ev / pv:4.2f}  CPI {ev / ac:4.2f}")
    PV += pv; EV += ev; AC += ac; BAC += bac
spi, cpi = EV / PV, EV / AC
print(f"Project: PV ${PV:,.0f}  EV ${EV:,.0f}  AC ${AC:,.0f}")
print(f"SPI {spi:.3f} CPI {cpi:.3f} EAC ${BAC / cpi:,.0f} (BAC ${BAC:,.0f})")Structure SPI 0.95 CPI 0.95 Envelope SPI 0.75 CPI 0.94 MEP rough-in SPI 1.04 CPI 1.05 Interiors SPI 0.50 CPI 0.88 Project: PV $6,820,000 EV $6,200,000 AC $6,400,000 SPI 0.909 CPI 0.969 EAC $12,180,645 (BAC $11,800,000)
The output shows the project slightly behind schedule and slightly over cost overall, with the envelope as the main problem on both counts: it is well behind plan, and the work done has cost more than budgeted. The MEP rough-in is ahead and roughly on budget. A dashboard would highlight the envelope for the project manager's attention; the conversation would then turn to why (crew size, material delays, rework, weather) and what to do.
Worked problem
Interpreting earned value
At month 8 of a 14-month project with a budget at completion of $18.0 million, PV = $9.6 million, EV = $8.8 million and AC = $9.4 million. Calculate SV, CV, SPI, CPI and EAC, and interpret.
Show solution
- SV = 8.8 − 9.6 = −$0.8 million (behind schedule).
- CV = 8.8 − 9.4 = −$0.6 million (over cost).
- SPI = 8.8 ÷ 9.6 ≈ 0.92; CPI = 8.8 ÷ 9.4 ≈ 0.94.
- EAC = 18.0 ÷ 0.94 ≈ $19.2 million, about $1.2 million over budget if performance continues.
Answer: The project has earned 92 % of planned value and gets about 94 cents of value per dollar spent; without corrective action it will finish about $1.2 million over budget.
Safety measures
Safety performance is usually reported as rates per hours worked so projects of different sizes can be compared. OSHA's total recordable incident rate (TRIR) multiplies the number of recordable injuries and illnesses by 200,000 (roughly 100 full-time workers for a year) and divides by hours worked; the DART rate does the same for cases involving days away, restricted work or job transfer. Owners also look at the experience modification rate (EMR) used by workers' compensation insurers. A rate is only comparable when the definition is the same.
Worked problem
Calculating incident rates
A general contractor and its subcontractors worked 412,000 hours on a project last year, with 5 OSHA-recordable injuries and 2 DART cases. Calculate the TRIR and DART rate.
Show solution
- TRIR = 5 × 200,000 ÷ 412,000 ≈ 2.43.
- DART rate = 2 × 200,000 ÷ 412,000 ≈ 0.97.
- Small numbers make these rates volatile: one more injury would raise the first rate by about 0.49.
- Leading indicators (observations, near misses, hazard assessments completed) give a more stable early picture.
Answer: TRIR about 2.4 and DART about 1.0. Track them alongside leading indicators.
Designing dashboards people use
A dashboard is a visual summary of the measures a particular audience needs to make decisions. The most common failure is trying to show everything to everyone. A superintendent needs this week's constraints, inspections and safety observations for the site; a project manager needs cost, schedule, RFIs, submittals and change; an executive needs a portfolio view of margin, risk and safety across projects. Each needs a different dashboard.
- Start from decisions: what will the viewer do differently based on each measure?
- Show few measures, each with a target or threshold and a trend, not a single number without context.
- Use simple chart types: bars for comparisons, lines for trends, tables for lists of exceptions.
- Highlight exceptions (projects or items outside thresholds) rather than making viewers hunt.
- State the data source and refresh time so viewers know how current the information is.
- Do not rely on color alone; use labels and symbols so the dashboard works for color-blind viewers and in print.
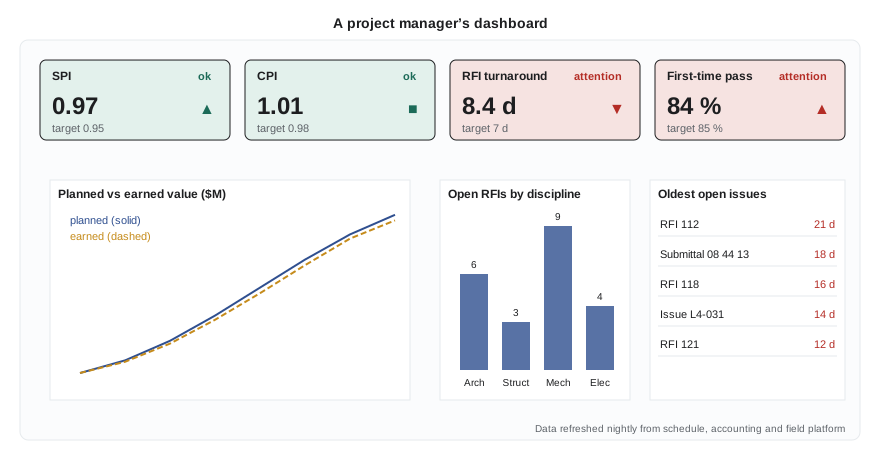
A dashboard should be reviewed in a regular meeting, or it will be ignored. Many contractors build a monthly project review around a standard dashboard, with the project manager explaining any measure outside its threshold and the actions planned.
Analysis beyond dashboards
Dashboards describe what is happening. Analysis tries to explain why and what might happen next. Simple techniques go a long way: comparing projects on normalized measures (cost per square meter, hours per unit), looking at trends over time, breaking a measure down by trade, location or cause, and checking correlations between leading and lagging indicators across many projects.
Worked problem
Comparing projects fairly
Two mid-rise residential projects report labor hours for drywall: Project A, 18,400 hours for 441,000 ft² of board; Project B, 15,900 hours for 350,000 ft² of board. Which is more productive?
Show solution
- Project A: 18,400 ÷ 441,000 ≈ 0.0417 hours per ft², or about 4.17 hours per 100 ft².
- Project B: 15,900 ÷ 350,000 ≈ 0.0454 hours per ft², or about 4.54 hours per 100 ft².
- Project A used about 8 % fewer hours per unit.
- Before drawing conclusions, check whether the projects are comparable: ceiling heights, number of corners and openings, board types, fire-rated assemblies and whether hours are coded consistently.
Answer: Project A appears about 8 % more productive per unit of board, but the difference is small enough that differences in scope or coding could explain it.
Correlation is not causation. A firm might find that projects with more RFIs have larger cost overruns; that does not mean RFIs cause overruns. Both may result from incomplete design. Analysis should prompt questions and investigation, not automatic conclusions. Lesson 10 returns to these cautions in the context of AI predictions.
Data governance
As data become more valuable, firms need rules for who owns which data, who can see them, how they are defined and how long they are kept. A data dictionary defines each measure (for example, exactly what counts as an RFI answered on time). A data owner is responsible for the quality of each data source. Access rules protect sensitive information such as wages, health and safety records and commercial terms. Retention rules follow legal requirements for records (often several years after completion, longer for some documents) and the firm's own needs. Lesson 11 covers privacy and security in more detail.
Common mistakes
MistakeBuilding dashboards before fixing data quality.
InsteadMeasure completeness, accuracy and consistency first, and fix the entry process.
MistakeShowing dozens of measures to every audience.
InsteadDesign each dashboard for one audience and its decisions, with few measures and clear thresholds.
MistakeComparing raw totals across projects.
InsteadNormalize by quantity, area or hours, and check that scope and coding are comparable.
MistakeRelying only on lagging indicators such as injury rates.
InsteadBalance them with leading indicators that give early warning.
MistakeTreating correlations as proof of cause.
InsteadUse analysis to raise questions, then investigate causes.
Summary and key terms
- Construction data come from many systems with different identifiers; common cost codes and location breakdowns connect them.
- Data quality has dimensions of completeness, accuracy, consistency, timeliness and uniqueness.
- Good KPIs are few, defined, comparable, decision-linked and balanced between leading and lagging indicators.
- Earned value gives SV, CV, SPI, CPI and EAC from planned value, earned value and actual cost.
- Safety rates per 200,000 hours allow comparison, but small numbers make them volatile.
- Dashboards should serve one audience, show trends and thresholds and highlight exceptions.
- Analysis normalizes measures and asks why; correlation is not causation.
- Data governance sets ownership, definitions, access and retention.
- KPI
- Key performance indicator: a measure tied to an important goal.
- Leading indicator
- A measure that predicts future outcomes.
- Lagging indicator
- A measure that records outcomes after the fact.
- Percent plan complete (PPC)
- The share of weekly commitments completed as promised.
- Planned value (PV)
- Budgeted cost of work scheduled to date.
- Earned value (EV)
- Budgeted cost of work actually completed.
- Cost performance index (CPI)
- EV divided by actual cost.
- Schedule performance index (SPI)
- EV divided by planned value.
- Data dictionary
- Definitions of data fields and measures.
- Normalization
- Dividing a measure by size or quantity so projects can be compared.
Practice problems
Work each problem on paper first, then reveal the answer to check.
Name three source systems for construction data.
Show answer
Accounting, scheduling, field platform, CDE, timekeeping, telematics, sensors (any three).
Logs exist for 180 of 200 project-days. What is the completeness?
Show answer
90 %.
Give one leading and one lagging safety indicator.
Show answer
Leading: near misses reported; lagging: recordable injury rate.
PV = $5.0M, EV = $4.5M, AC = $4.8M. Calculate SPI and CPI.
Show answer
SPI = 0.90; CPI ≈ 0.94.
With BAC = $12M and CPI = 0.96, what is EAC?
Show answer
$12.5M.
3 recordable injuries in 250,000 hours. What is the rate per 200,000 hours?
Show answer
2.4.
Why is PPC a leading indicator?
Show answer
Unreliable weekly plans tend to precede schedule slippage.
List three principles of good dashboard design.
Show answer
Design for decisions, few measures with targets and trends, highlight exceptions, state source and refresh, do not rely on color alone.
Why normalize before comparing projects?
Show answer
Projects differ in size; raw totals mislead.
What is a data dictionary?
Show answer
A set of definitions for each data field and measure.
Lesson quiz · 5 questions
Score 60% or more to complete this lesson.
Create a free account to save your progress, take quizzes and earn a certificate.