
CMPUT-421 · Lesson 9 of 12 · 36 min
Usability testing and experiments
Usability testing, in which representative users attempt realistic tasks with a product while observers watch, is the most direct and persuasive evaluation method in HCI. Watching a capable person fail to buy a ticket changes a team's mind in a way that no report can. Controlled experiments go further, comparing designs under conditions designed to support causal conclusions and statistical inference. This lesson covers planning and running usability tests, the think-aloud method, task and measure selection, the much-debated question of how many participants are needed, standard instruments such as the System Usability Scale and NASA-TLX, the statistics of small samples, and the design and analysis of experiments with counterbalancing and effect sizes. CMPUT-401 covers large-scale A/B tests on live products, and ROB-430 covers the analysis of user study data, including multiple comparisons and replication; this lesson concentrates on laboratory-style and remote studies of interface designs.
Formative and summative testing
Usability tests serve two purposes. Formative tests, during design, aim to find and understand problems so they can be fixed; they are small, qualitative and iterative, often with five to eight participants per round, and their main output is a list of problems with evidence. Summative tests, near the end, aim to measure usability against requirements or compare a design with a competitor or previous version; they need larger samples, careful measurement and statistics, and their output is numbers with confidence intervals. Confusing the two is a common failure: a team runs five participants and reports a 60 percent completion rate as if it were precise, or runs a large benchmark too late to fix what it finds.
Planning a test
A test plan specifies the research questions, the participants and how they will be recruited, the tasks, the measures, the setting (in person or remote, moderated or unmoderated), the roles of the team, and the consent and data handling (lesson 5). Participants should represent the intended users, with the characteristics that matter for the questions: for RideLine's fare redesign, first-time riders and riders who use screen readers were recruited specifically, rather than whoever was convenient. Recruiting colleagues, who know the product and the jargon, produces misleadingly smooth sessions.
Tasks should be realistic, specific and goal-based, without giving away the answer: 'You are visiting the city and staying at the Harbourfront Hotel. Buy the right fare to get there from the airport this evening' rather than 'Click Fares, then choose Zone 3.' Avoid using the interface's own labels in the task. Each task needs a defined success criterion and, for summative tests, a time limit. A pilot session with one or two people catches confusing tasks and technical problems before real participants are wasted.
Think-aloud and moderation
In the think-aloud method, introduced to HCI by Clayton Lewis in 1982 from protocol analysis work by K. Anders Ericsson and Herbert Simon, participants verbalize their thoughts as they work: what they are looking for, what they expect, what confuses them. Concurrent think-aloud gives direct insight into mental models and expectations, though it can slow participants slightly and change their behavior; retrospective think-aloud, in which participants comment while watching a recording of their session, avoids interference at the cost of memory errors. Ericsson and Simon distinguished level 1 and 2 verbalizations (reporting what is in attention) from level 3 (explaining and justifying), which is more reactive; many practitioners use a relaxed version with gentle prompts such as 'What are you thinking now?' or 'What do you expect to happen?'
The moderator's job is to keep the participant talking and working without helping or leading. Good moderators answer questions with questions ('What would you do if I weren't here?'), stay neutral when the participant struggles, never blame the participant, and let silence do its work. Observers take notes on problems, quotes and behavior, ideally on a shared template, and meet after each day to agree on findings. Recording the screen and voice, with consent, lets the team review critical moments. Remote moderated testing over video works well for most tasks and widens recruitment; unmoderated remote testing, through platforms that send tasks and record sessions, is fast and cheap but loses the ability to probe and is vulnerable to participants who rush.
Measures
Usability tests use behavioral, attitudinal and sometimes physiological measures. Task success (binary or graded) is the most fundamental. Time on task, usually for successful attempts, measures efficiency; because times are right-skewed, geometric means and log transformations are used. Errors and their types, number of assists, path deviations and lostness measures capture difficulty. After each task, a single ease question such as the Single Ease Question (SEQ, a 7-point rating of how easy the task was) captures perceived difficulty; after the session, a standardized questionnaire captures overall perceived usability. Qualitative observations, such as where people hesitated and what they said, explain the numbers.
How many participants?
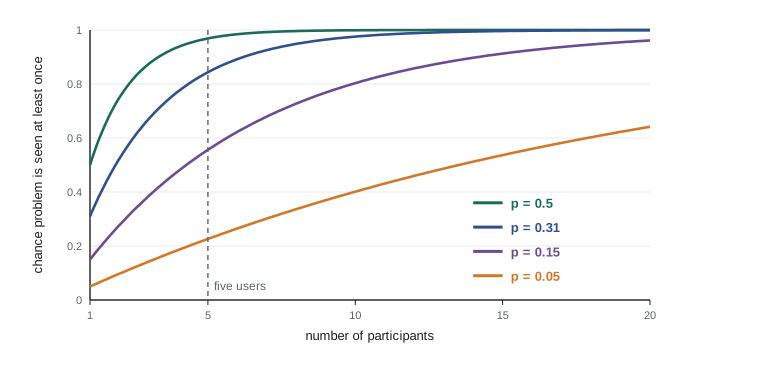
The claim that five users find 85 percent of usability problems, from Nielsen and Landauer's 1993 model and popularized in Nielsen's 2000 article 'Why you only need to test with 5 users', is one of the most cited and most misunderstood ideas in HCI. The model is the one from lesson 8: if a problem affects a proportion p of users, the probability that it is seen at least once among n participants is
With p = 0.31, the average detection rate in some of Nielsen's data, five users give \(1 - 0.69^5 \approx 0.84\). The claim holds for problems that affect about a third of users, in a single, homogeneous user group, for a fixed set of tasks. It fails for less common problems: a problem that affects 5 percent of users, such as one that only screen reader users or people on old phones encounter, has only a 23 percent chance of appearing with five users. Laura Faulkner's 2003 study found that sets of five participants drawn from a larger pool found anywhere from 55 to nearly 100 percent of the problems. The sensible reading, which Nielsen himself gave, is to run small tests iteratively, five or so per round per user group, fixing problems between rounds, rather than to stop after five users.
# How many participants? The problem-discovery model P(found at least once) = 1 - (1 - p)^n,
# and an adjusted-Wald confidence interval for a small-sample completion rate.
import math
print("chance a problem is seen at least once with n participants")
print("  p     n=3   n=5   n=8   n=12  n=20")
for p in (0.50, 0.31, 0.15, 0.05):
    print(f"  {p:.2f} " + " ".join(f"{1 - (1 - p) ** n:5.0%}" for n in (3, 5, 8, 12, 20)))
def n_for(p, goal=0.85):
    return math.ceil(math.log(1 - goal) / math.log(1 - p))
print("participants for an 85% chance of seeing a problem affecting 10% of users:", n_for(0.10))
def adj_wald(k, n, z=1.96):          # Agresti-Coull: add z^2/2 successes and z^2 trials
    nn = n + z * z; pp = (k + z * z / 2) / nn
    h = z * math.sqrt(pp * (1 - pp) / nn)
    return max(0.0, pp - h), min(1.0, pp + h)
def wald(k, n, z=1.96):
    p = k / n; h = z * math.sqrt(p * (1 - p) / n)
    return p - h, p + h
for k, n in ((6, 8), (8, 8), (4, 5)):
    lo, hi = adj_wald(k, n); wl, wh = wald(k, n)
print(f"{k}/{n} completed: adjusted Wald 95% CI {lo:.0%}-{hi:.0%}; plain Wald {wl:.0%}-{wh:.0%}")chance a problem is seen at least once with n participants p n=3 n=5 n=8 n=12 n=20 0.50 88% 97% 100% 100% 100% 0.31 67% 84% 95% 99% 100% 0.15 39% 56% 73% 86% 96% 0.05 14% 23% 34% 46% 64% participants for an 85% chance of seeing a problem affecting 10% of users: 19 6/8 completed: adjusted Wald 95% CI 40%-94%; plain Wald 45%-105% 8/8 completed: adjusted Wald 95% CI 63%-100%; plain Wald 100%-100% 4/5 completed: adjusted Wald 95% CI 36%-98%; plain Wald 45%-115%
Small-sample statistics
Summative tests often have small samples, which makes interval estimates essential and some textbook methods unreliable. For a completion rate, the familiar Wald interval \(\hat{p} \pm z\sqrt{\hat{p}(1-\hat{p})/n}\) behaves badly when n is small or p is near 0 or 1: for 8 successes in 8 attempts it gives an interval of zero width, as if the completion rate were certainly 100 percent. Jeff Sauro and James Lewis, in Quantifying the User Experience (2nd edition, 2016), recommend the adjusted Wald (Agresti–Coull) interval, which adds \(z^2/2\) successes and \(z^2\) trials before computing the interval; the Wilson score interval used in lesson 6 is similar. The program above shows that 6 of 8 completions corresponds to a plausible range of roughly 40 to 94 percent, a sobering reminder of what small samples can and cannot tell.
For task times, Sauro and Lewis recommend log-transforming times, computing a confidence interval on the log scale with the t distribution and transforming back, which yields an interval around the geometric mean. For satisfaction scores, t-based intervals on the mean work well for multi-item questionnaires such as SUS. And for comparisons, the appropriate test depends on the design: independent-samples tests for between-subjects designs, paired tests for within-subjects designs, and tests for proportions such as Fisher's exact test or the N−1 two-proportion test for completion rates.
Standardized questionnaires
The System Usability Scale (SUS), created by John Brooke at Digital Equipment Corporation in 1986 and published in 1996, is the most widely used post-test questionnaire. It has ten statements, alternating positive ('I thought the system was easy to use') and negative ('I found the system unnecessarily complex'), rated from 1 (strongly disagree) to 5 (strongly agree). To score it, subtract 1 from each odd-numbered (positive) item's rating, subtract each even-numbered (negative) item's rating from 5, sum the ten contributions and multiply by 2.5, giving a score from 0 to 100. A SUS score is not a percentage. Across hundreds of published studies, the mean is about 68; Sauro and Lewis's curved grading scale maps scores to percentiles and letter grades, with about 80 or above corresponding to the top tenth or so of products. SUS is reliable even with small samples and works for almost any interface, which is its great strength; its weakness is that it says nothing about why a score is low.
Other instruments serve other purposes. The UMUX-Lite (two items) is a short alternative that correlates highly with SUS. The NASA Task Load Index (NASA-TLX), developed by Sandra Hart and Lowell Staveland at NASA Ames in the 1980s, measures perceived workload on six subscales: mental demand, physical demand, temporal demand, performance, effort and frustration, each rated from 0 to 100. In the original weighted version, participants make 15 pairwise comparisons of which subscale contributed more to workload, and each subscale is weighted by the number of times it was chosen; the raw TLX simply averages the six ratings and is widely used because it is quicker and correlates highly with the weighted score. The AttrakDiff and UEQ questionnaires measure hedonic as well as pragmatic qualities of user experience.
# Scoring the System Usability Scale (Brooke, 1996) and a weighted NASA-TLX.
# SUS: 10 items rated 1-5; odd items positive, even items negative; total x 2.5 gives 0-100.
import statistics as st
def sus(r):
    odd = sum(r[i] - 1 for i in range(0, 10, 2)); even = sum(5 - r[i] for i in range(1, 10, 2))
    return (odd + even) * 2.5
old_app = [[3, 4, 3, 3, 2, 4, 3, 4, 2, 3], [4, 2, 4, 2, 3, 3, 4, 2, 4, 2], [2, 4, 2, 4, 2, 4, 2, 5, 2, 4],
           [3, 3, 3, 2, 3, 3, 3, 3, 3, 3], [2, 5, 2, 3, 2, 4, 3, 4, 1, 4], [4, 3, 3, 2, 3, 3, 4, 3, 3, 2]]
new_app = [[4, 2, 4, 1, 4, 2, 5, 1, 4, 2], [5, 1, 5, 2, 4, 1, 5, 1, 5, 1], [4, 2, 4, 2, 4, 2, 4, 2, 4, 2],
           [3, 2, 4, 2, 4, 2, 4, 2, 3, 3], [5, 2, 4, 1, 5, 1, 4, 2, 4, 1], [4, 2, 5, 1, 4, 2, 4, 1, 4, 2]]
for name, data in (("old app", old_app), ("redesign", new_app)):
    scores = [sus(r) for r in data]
    print(f"{name:9} SUS scores {scores}  mean {st.mean(scores):.1f}")
print("(a mean of about 68 is average across many published studies)")
# NASA-TLX: six subscales rated 0-100, weighted by 15 pairwise "which mattered more" choices
ratings = {"mental": 70, "physical": 10, "temporal": 60, "performance": 40, "effort": 65, "frustration": 55}
tally = {"mental": 4, "physical": 0, "temporal": 3, "performance": 2, "effort": 3, "frustration": 3}
assert sum(tally.values()) == 15
weighted = sum(ratings[k] * tally[k] for k in ratings) / 15
raw = st.mean(ratings.values())
print(f"NASA-TLX workload for one rider in the old app: weighted {weighted:.1f}, raw (unweighted) {raw:.1f}")old app SUS scores [37.5, 70.0, 22.5, 52.5, 25.0, 60.0] mean 44.6 redesign SUS scores [82.5, 95.0, 75.0, 67.5, 87.5, 82.5] mean 81.7 (a mean of about 68 is average across many published studies) NASA-TLX workload for one rider in the old app: weighted 60.0, raw (unweighted) 50.0
The old app's SUS scores cluster well below 68, and the redesign's are well above, a difference that matches the qualitative findings. Note how widely individual scores vary, from 22.5 to 70 for the old app, and with six participants per version the means are imprecise. The NASA-TLX shows the old app's workload driven by mental demand, effort and time pressure, which is consistent with the fare-zone confusion observed in the sessions.
Controlled experiments
When the question is causal, such as whether a list layout lets riders find their departure faster than a map layout, a controlled experiment is the right tool. The independent variable (the design) is manipulated; the dependent variables (time, errors, ratings) are measured; other factors are held constant or randomized. Hypotheses should be stated before the data are collected, ideally preregistered, to avoid the garden of forking paths in which many possible analyses inflate the chance of a spurious finding (ROB-430 discusses the replication crisis).
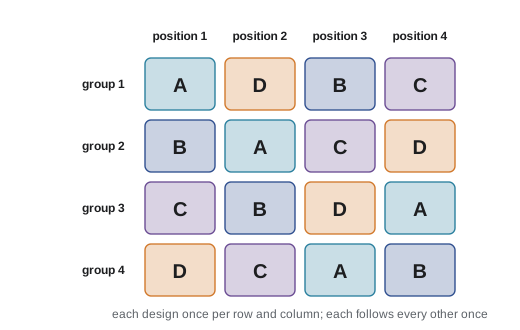
In a between-subjects design, each participant uses one condition. It avoids carryover effects such as learning and fatigue, but needs more participants because differences between people add noise. In a within-subjects design, each participant uses every condition. It controls individual differences and needs fewer participants, but order effects (practice, fatigue, carryover) must be controlled by counterbalancing: varying the order of conditions across participants so that order is not confounded with condition. For two conditions, half the participants do AB and half BA. For more conditions, a Latin square assigns orders so that each condition appears in each position equally often; a balanced Latin square (Williams design) also ensures that each condition follows every other condition equally often, controlling first-order carryover.
Analysis then compares conditions with an appropriate test and, just as important, reports an effect size and a confidence interval, not only a p-value. A p-value says how surprising the data would be if there were no difference; it does not say how big or important the difference is. For a paired design, Cohen's \(d_z\), the mean difference divided by the standard deviation of the differences, is a common standardized effect size; in many usability contexts the raw difference in seconds or percentage points is more meaningful. The program below runs a counterbalanced within-subjects comparison of RideLine's list and map arrivals screens.
# A within-subjects experiment: 12 participants find the next departure with two
# arrivals-screen designs (A = list, B = map). Counterbalanced orders, paired t-test
# on log task times, and an effect size. Invented, seeded data.
import math, random, statistics as st
from scipy import stats
random.seed(421)
orders = ["AB", "BA"] * 6                      # counterbalancing for two conditions
times = []
for p, order in enumerate(orders):
    skill = random.gauss(0, 0.25)              # some people are faster in general
    t = {}
    for pos, cond in enumerate(order):
        base = 12.0 if cond == "A" else 17.0   # seconds; the list is faster on average
        learn = 0.9 if pos == 1 else 1.0       # second trial benefits from practice
        t[cond] = base * learn * math.exp(skill + random.gauss(0, 0.15))
    times.append((t["A"], t["B"]))
la = [math.log(a) for a, b in times]; lb = [math.log(b) for a, b in times]
diff = [y - x for x, y in zip(la, lb)]
res = stats.ttest_rel(lb, la)
dz = st.mean(diff) / st.stdev(diff)
print(f"geometric mean time: list A {math.exp(st.mean(la)):.1f} s, map B {math.exp(st.mean(lb)):.1f} s")
print(f"B takes {math.exp(st.mean(diff)) - 1:.0%} longer; paired t({len(diff) - 1}) = {res.statistic:.2f}, p = {res.pvalue:.4f}, d_z = {dz:.2f}")
def balanced_latin(n):                         # Williams design: each condition follows each other once
    rows = []
    for r in range(n):
        seq, j, k = [], 0, 0
        for i in range(n):
            val = (r + j) % n if i % 2 == 0 else (r + n - k - 1) % n
            if i % 2 == 0: j += 1
            else: k += 1
            seq.append("ABCD"[val])
        rows.append("".join(seq))
    return rows
print("balanced Latin square for four designs:", balanced_latin(4))geometric mean time: list A 10.5 s, map B 14.2 s B takes 35% longer; paired t(11) = 5.42, p = 0.0002, d_z = 1.56 balanced Latin square for four designs: ['ADBC', 'BACD', 'CBDA', 'DCAB']
The list layout is substantially faster, the paired test on log times is highly significant, and the effect size is very large, because the within-subjects design removes the large differences in overall speed between people. The log transformation makes the analysis compare ratios of times, which suits skewed time data, and the result is reported as a percentage difference. With only 12 participants and a large effect, the conclusion is solid; for a subtle difference, a power analysis before the study would show that many more participants were needed. The Latin square printed at the end is the one in the figure, ready for a follow-up study comparing four designs.
Worked examples
Worked problem
Scoring SUS
A participant rates the ten SUS items 4, 2, 4, 1, 3, 2, 5, 1, 4, 2. Compute the score.
Show solution
- Odd items contribute rating − 1: (4 − 1) + (4 − 1) + (3 − 1) + (5 − 1) + (4 − 1) = 3 + 3 + 2 + 4 + 3 = 15.
- Even items contribute 5 − rating: (5 − 2) + (5 − 1) + (5 − 2) + (5 − 1) + (5 − 2) = 3 + 4 + 3 + 4 + 3 = 17.
- Score: \((15 + 17) \times 2.5 = 80\).
Answer: A SUS score of 80, well above the average of about 68.
Worked problem
Problem discovery
How many participants give at least a 90 percent chance of seeing a problem that affects 20 percent of users at least once?
Show solution
- Require \(1 - 0.8^n \ge 0.9\), so \(0.8^n \le 0.1\).
- \(n \ge \ln 0.1 / \ln 0.8 \approx 10.3\), so 11 participants.
Answer: Eleven participants from that user group.
Worked problem
Adjusted Wald by hand
Five of five participants complete a task. Compute the adjusted Wald 95 percent interval with z ≈ 2.
Show solution
- Adjusted counts: \(\tilde{n} = 5 + 4 = 9\), \(\tilde{p} = (5 + 2)/9 \approx 0.778\).
- Half-width: \(2\sqrt{0.778 \times 0.222 / 9} \approx 2 \times 0.139 = 0.277\).
- Interval: about 0.50 to 1.0 (capped at 1).
Answer: Roughly 50 to 100 percent: five successes out of five is encouraging but far from proof of a high completion rate.
Common mistakes
MistakeFive users are always enough.
InsteadFive users per round find common problems in one user group; rare problems and multiple groups need more, and testing should be iterative.
MistakeReport a completion rate of 7/8 as 87.5 percent without an interval.
InsteadReport a confidence interval, such as the adjusted Wald, which here spans roughly 51 to 99 percent.
MistakeA SUS score of 70 means the system is 70 percent usable.
InsteadSUS is not a percentage; interpret it against benchmarks, where about 68 is average.
MistakeRun every participant in the same condition order in a within-subjects study.
InsteadCounterbalance orders, for example with a balanced Latin square, so practice and fatigue are not confounded with condition.
MistakeA significant p-value means the difference matters.
InsteadReport effect sizes and confidence intervals; a tiny difference can be significant with a large sample.
Summary and key terms
- Formative tests find problems with small samples; summative tests measure usability with larger samples and statistics.
- Tasks should be realistic, goal-based and free of interface labels; pilot every test.
- Think-aloud reveals expectations and mental models; moderators must stay neutral and not help.
- The discovery model 1 − (1 − p)^n shows five participants find common problems but miss rare ones; test iteratively and per user group.
- Use adjusted Wald or Wilson intervals for small-sample completion rates and log-transformed times for task times.
- SUS scores range from 0 to 100 with an average near 68; NASA-TLX measures workload on six subscales.
- Experiments manipulate an independent variable; within-subjects designs need counterbalancing, and results need effect sizes and intervals.
- Formative evaluation
- Evaluation during design aimed at finding and fixing problems.
- Summative evaluation
- Evaluation that measures usability against requirements or alternatives.
- Think-aloud protocol
- A method in which participants verbalize their thoughts while performing tasks.
- Problem discovery model
- The formula 1 − (1 − p)^n for the probability of seeing a problem at least once among n participants.
- Adjusted Wald interval
- A confidence interval for a proportion that adds z²/2 successes and z² trials, suited to small samples.
- System Usability Scale
- A ten-item questionnaire yielding a perceived usability score from 0 to 100.
- NASA-TLX
- A workload measure with six subscales: mental, physical and temporal demand, performance, effort and frustration.
- Within-subjects design
- An experimental design in which each participant experiences every condition.
- Counterbalancing
- Varying the order of conditions across participants to control order effects.
- Balanced Latin square
- An ordering scheme in which each condition appears once in each position and follows each other condition equally often.
Practice problems
Work each problem on paper first, then reveal the answer to check.
Distinguish formative from summative usability testing.
Show answer
Formative finds problems to fix during design; summative measures usability against targets or alternatives.
Rewrite the task "Click Fares and buy a Zone 3 ticket" to be realistic and unbiased.
Show answer
For example: "You are traveling from the airport to your hotel downtown tonight. Get the right ticket."
What is the chance that five users see a problem affecting 10 percent of users?
Show answer
1 − 0.9⁵ ≈ 41 percent.
Why does the plain Wald interval fail for 8 out of 8 successes?
Show answer
It has zero width, implying certainty, because p(1 − p) = 0.
How do you score an even-numbered SUS item?
Show answer
Subtract the rating from 5.
What is the approximate average SUS score across studies?
Show answer
About 68.
Name the six NASA-TLX subscales.
Show answer
Mental demand, physical demand, temporal demand, performance, effort and frustration.
Why do within-subjects designs need fewer participants?
Show answer
Each participant serves as their own control, removing individual differences from the comparison.
What extra property does a balanced Latin square have over a plain one?
Show answer
Each condition follows every other condition equally often, controlling first-order carryover.
Why analyze task times on a log scale?
Show answer
Times are right-skewed; logs make them closer to normal and compare ratios.
Lesson quiz · 5 questions
Score 60% or more to complete this lesson.
Create a free account to save your progress, take quizzes and earn a certificate.