
CMPUT-421 · Lesson 6 of 12 · 34 min
From research to requirements: tasks, personas and scenarios
Research produces findings; design needs requirements and concepts. This lesson covers the bridge between them: task analysis, which describes what users do in enough detail to design for; personas and scenarios, which keep a team's attention on specific people and situations; storyboards and journey maps, which show interaction over time; and information architecture, which organizes content and functions so that people can find them, using card sorting and tree testing. CMPUT-301 covers requirements engineering in general (functional and non-functional requirements, use cases, user stories and acceptance criteria) and CMPUT-401 covers problem framing and jobs to be done; this lesson adds the user-centered techniques that feed them.
Task analysis
A task is an activity a person undertakes to achieve a goal. Task analysis decomposes tasks into their parts, the order and conditions in which they occur, and the knowledge, information and tools they require. Hierarchical task analysis (HTA), developed by John Annett and Keith Duncan in the 1960s for training analysis, describes a goal as a hierarchy of subgoals and operations, with plans that say in what order and under what conditions the subgoals are done. HTA is simple, flexible and still the most used form.
Consider the RideLine goal 0, 'travel to an unfamiliar destination by transit'. Its subgoals might be 1, plan the trip; 2, obtain a valid fare; 3, get to the departure stop; 4, ride and transfer; 5, exit at the right stop. Subgoal 2 decomposes into 2.1, determine the fare needed; 2.2, choose how to pay; 2.3, pay; 2.4, carry proof of payment. The plan for 2 might read: do 2.1; if the rider has a valid pass, skip to 2.4; otherwise do 2.2 and 2.3, then 2.4. Writing the plan exposes decisions that the interface must support (how does a rider determine the fare needed?) and places where errors are likely (2.1 for a rider who does not understand zones).
Other forms of task analysis serve other purposes. Cognitive task analysis focuses on the knowledge and decision-making behind expert performance, using interviews and observation of critical incidents, and suits complex domains such as transit dispatch. GOMS (lesson 3) is a task analysis precise enough to predict times. Workflow and sequence models from contextual design show how work moves between people and systems. Whatever the form, task analysis should describe what users actually do, gathered from research, rather than what a procedure manual says they should do.
Personas
A persona is a fictional but evidence-based archetype of a user group, described as a specific person with a name, a photograph or sketch, goals, behaviors, frustrations, skills and context. Alan Cooper introduced personas in The Inmates Are Running the Asylum (1999) to stop teams from designing for an elastic 'user' who stretches to fit whatever feature is being discussed. A good persona is grounded in research data, focuses on goals and behaviors rather than demographics, and comes in a small set with a primary persona whose needs the design must satisfy first.
RideLine's research produced four personas. Amara, a nurse who commutes daily on two routes and holds a monthly pass, wants the next departure and service alerts with no fuss. Gerald, a retired teacher who rides a few times a month and uses a screen reader because of macular degeneration, wants to know arrival times and whether stops and vehicles are accessible, without hunting through a map. Sofia, a university student on a tight budget, wants the cheapest fare and works with an old phone and limited data. Daniel, a visitor attending a conference, does not know the system at all and wants to get from the airport to his hotel without buying the wrong ticket. The team chose Daniel and Gerald as primary personas for the fare and arrivals redesign, reasoning that a design that works for an unfamiliar visitor and for a screen reader user will also work for Amara.
Personas have critics. They can be invented from stereotypes rather than data, which embeds bias in the design; they can become marketing segments with demographic detail but no behavioral insight; and teams can create them and then ignore them. Some practitioners prefer behavioral archetypes without names or faces, or jobs-to-be-done statements ('When I arrive in a new city, I want to get to my hotel by transit without risking a fine, so I can save money without stress'), which focus on the situation rather than the person. Microsoft's inclusive design toolkit introduced the persona spectrum, which considers permanent, temporary and situational versions of a limitation (one arm, an arm injury, holding a baby), a useful antidote to treating disability as a niche (lesson 10).
Scenarios, storyboards and journey maps
A scenario is a short narrative describing a persona using a product to achieve a goal in a specific situation. Scenarios make requirements concrete and expose context that lists of features miss. John Carroll's scenario-based design (2000) uses problem scenarios, which describe current practice and its difficulties, and activity, information and interaction scenarios, which describe the envisioned design at increasing levels of detail. A problem scenario for Daniel: 'Daniel lands at 23:10. The airport bus is about to leave. He opens RideLine, which asks him to choose a zone before he can buy a ticket. He does not know which zone his hotel is in, guesses zone 1, and on the bus a sign says the airport is in zone 3.' The envisioned scenario describes how the redesign helps: the fare screen asks where he is going and calculates the fare.
A storyboard presents a scenario visually, as a sequence of panels like a comic strip, showing the setting, the person, the device and the interaction. Storyboards communicate context quickly to stakeholders and help teams spot gaps, such as the fact that Daniel's phone is at 8 percent battery or that he is wheeling a suitcase. A customer journey map shows a person's experience across a whole service over time, typically in phases (plan, buy, travel, arrive), with the actions, touchpoints (app, ticket machine, driver, signage), thoughts and emotions at each step, and identifies pain points and opportunities. Journey maps are especially useful for transit, where the app is only one touchpoint among many, and a service blueprint extends the map below the 'line of visibility' to show the back-office processes that support each step.
These artifacts feed requirements. A user requirement states what users need to be able to do, under what conditions and to what standard, often written in a measurable way: 'A first-time rider shall be able to buy the correct fare for a planned trip within 90 seconds without consulting the zone map, with at least 90 percent success.' ISO/IEC 25066 describes how to report usability evaluations against such requirements. In agile teams, the same content becomes user stories with acceptance criteria, as covered in CMPUT-301.
Information architecture
Information architecture (IA) is the structural design of shared information environments: how content and functions are organized, labeled and connected so that people can find what they need. Louis Rosenfeld and Peter Morville's 'polar bear book', Information Architecture for the World Wide Web (1998, now in its fourth edition), describes four systems: organization (how content is grouped: by topic, task, audience, time or location), labeling (what groups and links are called), navigation (how people move through the structure: global, local and contextual navigation, breadcrumbs) and search. IA problems are common causes of failure in usability tests: users cannot find a function not because it is badly designed but because it is filed under a label they do not recognize.
Organization schemes can be exact (alphabetical, chronological, geographical) or ambiguous (by topic, task or audience). Ambiguous schemes are harder to design but often more useful, because users rarely know the exact name of what they want. Labels should use users' vocabulary, which research reveals; transit agencies call them 'fare products', riders say 'tickets' and 'passes'. Navigation should show users where they are, where they can go and how to get back. Search complements browsing but does not replace it; many users browse first, and search fails when the user does not know what the thing is called.
Card sorting
Card sorting reveals how users group and label content. Each item (a topic, function or page) is written on a card, physical or virtual, and participants sort the cards into groups that make sense to them. In an open sort, participants create and name their own groups, which reveals their mental models and vocabulary; in a closed sort, they sort cards into predefined categories, which tests a proposed structure. Typical studies use 30 to 60 cards and 15 to 30 participants for open sorts, though useful patterns often appear with fewer. Analysis builds a similarity matrix recording how often each pair of cards was grouped together and then clusters it.
# Open card sort analysis: 15 invented participants grouped 10 RideLine help topics.
# Build a co-occurrence (similarity) matrix and cluster it with average-linkage
# agglomerative clustering, printing the merge order (the dendrogram as text).
import random, itertools
random.seed(421)
cards = ["Day pass", "Monthly pass", "Fare zones", "Refunds", "Lost card",
         "Elevator outages", "Step-free routes", "Bike racks", "Detours", "Real-time arrivals"]
# hidden "true" groupings that participants roughly follow, with noise
truth = [[0, 1, 2], [3, 4], [5, 6, 7], [8, 9]]
sorts = []
for p in range(15):
    groups = [list(g) for g in truth]
    for c in range(len(cards)):
        if random.random() < 0.18:                       # sometimes a card goes elsewhere
            for g in groups:
                if c in g: g.remove(c)
            random.choice(groups).append(c)
    sorts.append([g for g in groups if g])
n = len(cards)
sim = [[0.0] * n for _ in range(n)]
for groups in sorts:
    for g in groups:
        for i, j in itertools.permutations(g, 2):
            sim[i][j] += 1 / len(sorts)
pairs = sorted(((sim[i][j], cards[i], cards[j]) for i in range(n) for j in range(i + 1, n)), reverse=True)
print("most often grouped together:")
for s, a, b in pairs[:4]:
    print(f"  {s:.0%}  {a} + {b}")
clusters = {i: [i] for i in range(n)}
def link(A, B):                                          # average similarity between clusters
    return sum(sim[i][j] for i in A for j in B) / (len(A) * len(B))
print("merge order (similarity at merge):")
while len(clusters) > 1:
    a, b = max(itertools.combinations(clusters, 2), key=lambda ab: link(clusters[ab[0]], clusters[ab[1]]))
    s = link(clusters[a], clusters[b])
    if s >= 0.3:
        print(f"  {s:.2f}  " + " | ".join(cards[i] for i in clusters[a]) + "  <->  " + " | ".join(cards[i] for i in clusters[b]))
    clusters[a] = clusters[a] + clusters.pop(b)
print("clusters below 0.30 similarity are left unmerged in the proposed navigation")most often grouped together: 87% Day pass + Fare zones 80% Step-free routes + Bike racks 80% Elevator outages + Bike racks 80% Day pass + Monthly pass merge order (similarity at merge): 0.87 Day pass <-> Fare zones 0.80 Elevator outages <-> Bike racks 0.77 Day pass | Fare zones <-> Monthly pass 0.77 Elevator outages | Bike racks <-> Step-free routes 0.73 Refunds <-> Lost card 0.73 Detours <-> Real-time arrivals clusters below 0.30 similarity are left unmerged in the proposed navigation
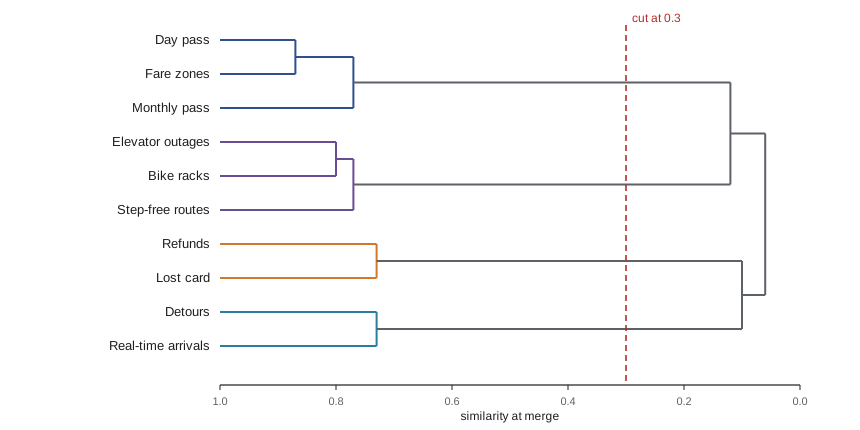
The merges recover four groups that match the participants' underlying mental model: fares and passes, account problems (refunds and lost cards), station facilities (elevator outages, step-free routes and bike racks) and service information (detours and real-time arrivals). The order of merges, shown as a dendrogram, indicates which groupings are strong (merged at high similarity) and which are looser. One surprise is instructive: participants grouped bike racks with elevators more often than elevators with step-free routes, which suggests that riders think of this group as 'stations and facilities' rather than 'accessibility', and that label matters for findability. Clustering is only a starting point: researchers also read the group names participants created, which suggest labels, and look for cards that participants placed inconsistently, which often need clearer names or should appear in more than one place.
Tree testing
Tree testing, sometimes called reverse card sorting, evaluates a proposed hierarchy without any visual design. Participants see only the text labels of the navigation tree and are asked to find where they would look to complete tasks ('Where would you report a broken elevator at a station?'). Measures include success (did they choose a correct location?), directness (did they get there without backtracking?) and time. Because the tree is stripped of layout, search and visual cues, tree testing isolates the quality of the organization and labels. It works well online with 30 to 50 participants per tree, and two candidate trees can be compared.
# Tree test results for two candidate navigation structures (invented data, 40 participants each).
# Success: chose the right location; directness: got there without backtracking.
import math
def wilson(k, n, z=1.96):
    p = k / n; d = 1 + z * z / n
    c = (p + z * z / (2 * n)) / d; h = z * math.sqrt(p * (1 - p) / n + z * z / (4 * n * n)) / d
    return c - h, c + h
tasks = ["Find the price of a day pass", "Report a broken elevator", "Check if a route is step-free", "Ask for a refund"]
A = [(34, 29), (18, 12), (22, 15), (31, 27)]           # (successes, direct successes) of 40
B = [(35, 31), (33, 28), (31, 26), (30, 24)]
print(f"{'task':32} {'A success':>16} {'B success':>16}")
for t, (sa, da), (sb, db) in zip(tasks, A, B):
    la, ha = wilson(sa, 40); lb, hb = wilson(sb, 40)
    print(f"{t:32} {sa / 40:4.0%} [{la:.0%}-{ha:.0%}] {sb / 40:4.0%} [{lb:.0%}-{hb:.0%}]")
print("directness A:", ", ".join(f"{d / 40:.0%}" for _, d in A), " B:", ", ".join(f"{d / 40:.0%}" for _, d in B))task A success B success Find the price of a day pass 85% [71%-93%] 88% [74%-95%] Report a broken elevator 45% [31%-60%] 82% [68%-91%] Check if a route is step-free 55% [40%-69%] 78% [62%-88%] Ask for a refund 78% [62%-88%] 75% [60%-86%] directness A: 72%, 30%, 38%, 68% B: 78%, 70%, 65%, 60%
Tree B, built from the card sort, clearly outperforms tree A on reporting an elevator and checking step-free routes, the two tasks where tree A filed accessibility under 'Customer service'. With 40 participants per tree the confidence intervals are wide, and for the day-pass and refund tasks the trees are indistinguishable. Lesson 9 explains the Wilson interval used here and why it behaves better than the textbook normal approximation for proportions near 0 or 1 and for small samples.
Worked examples
Worked problem
Writing an HTA plan
Write subgoals and a plan for the RideLine goal "check when my next bus arrives".
Show solution
- Subgoals: 1 open the app; 2 select the stop (2.1 use a saved stop, or 2.2 search for a stop, or 2.3 find the nearest stop by location); 3 read the arrival time; 4 check for alerts.
- Plan for 2: if the stop is saved, do 2.1; else if location is enabled and the rider is at the stop, do 2.3; else do 2.2.
- Plan for 0: do 1, 2, 3; do 4 if an alert icon is shown.
Answer: The plan exposes three ways to select a stop; the design should make the saved-stop path the fastest and handle location being off.
Worked problem
A measurable user requirement
Turn "The fare screen should be easy for visitors" into a measurable requirement.
Show solution
- Specify the users: first-time riders unfamiliar with the fare system.
- Specify the goal and conditions: buy the correct fare for a planned trip using the app, without help.
- Specify the standard: at least 90 percent success, median time under 90 seconds, measured in a usability test with at least 8 participants.
Answer: A first-time rider shall be able to buy the correct fare for a planned trip without help, with at least 90 percent success and a median time under 90 seconds.
Worked problem
Reading a similarity matrix
In a card sort with 20 participants, "Refunds" and "Lost card" were grouped together by 14 participants, and "Refunds" and "Monthly pass" by 5. What are their similarities, and what does that suggest?
Show solution
- Similarity is the proportion of participants who grouped the pair: 14/20 = 0.70 and 5/20 = 0.25.
- Refunds belong with account problems in most participants' minds, not with fare products.
- A cross-link from the monthly pass page to refunds may still help the minority.
Answer: 0.70 versus 0.25: file refunds with account problems and add a contextual link from fare pages.
Common mistakes
MistakeCreate personas in a workshop from the team's assumptions.
InsteadPersonas must be grounded in research data, or they encode the team's biases.
MistakeDesign for "the user", meaning everyone.
InsteadChoose primary personas and scenarios so that design decisions can be argued against specific needs.
MistakeOrganize the app by the agency's departments.
InsteadOrganize by users' tasks and mental models, discovered through research and card sorting.
MistakeUse a tree test to evaluate the visual design of the menu.
InsteadTree tests deliberately strip visual design to evaluate the structure and labels only.
MistakeTrust the dendrogram's clusters as the final navigation.
InsteadClustering suggests groupings; read participants' labels, check weak merges and validate with a tree test.
Summary and key terms
- Task analysis, especially hierarchical task analysis, decomposes goals into subgoals and plans that reveal decisions and likely errors.
- Personas are research-based archetypes that keep design focused on specific goals and behaviors; they fail when invented from stereotypes.
- Scenarios, storyboards and journey maps describe use in context and over time and expose requirements that feature lists miss.
- User requirements should be measurable, stating users, goals, conditions and standards.
- Information architecture covers organization, labeling, navigation and search.
- Open card sorting reveals users' groupings and vocabulary; similarity matrices and hierarchical clustering summarize them.
- Tree testing evaluates a proposed hierarchy with text labels only, measuring success and directness.
- Hierarchical task analysis
- A method that describes a goal as a hierarchy of subgoals with plans governing their order.
- Persona
- A fictional, research-based archetype of a user group described as a specific person.
- Scenario
- A narrative of a person using a system to achieve a goal in a specific situation.
- Storyboard
- A sequence of illustrated panels showing a scenario.
- Journey map
- A visualization of a person's experience across a service over time, including touchpoints and emotions.
- Information architecture
- The organization, labeling, navigation and search systems of an information space.
- Open card sort
- A card sort in which participants create and name their own groups.
- Closed card sort
- A card sort in which participants place cards into predefined categories.
- Tree testing
- Evaluating a navigation hierarchy by asking participants to find items using text labels only.
- Directness
- In a tree test, the share of participants who reached the answer without backtracking.
Practice problems
Work each problem on paper first, then reveal the answer to check.
What does a plan add to a hierarchical task analysis?
Show answer
The order and conditions under which subgoals are carried out.
Who introduced personas in interaction design, and why?
Show answer
Alan Cooper, to stop teams designing for an elastic, undefined user.
Give two criticisms of personas.
Show answer
They can be based on stereotypes rather than data, and teams can create them and then ignore them.
What is the persona spectrum?
Show answer
Microsoft's idea of considering permanent, temporary and situational versions of a limitation.
What extra layer does a service blueprint add to a journey map?
Show answer
The back-office processes and systems below the line of visibility that support each step.
Name the four systems of information architecture in Rosenfeld and Morville.
Show answer
Organization, labeling, navigation and search.
When would you choose a closed rather than an open card sort?
Show answer
To test whether users can place content into a proposed set of categories.
How is similarity computed in card sort analysis?
Show answer
As the proportion of participants who placed two cards in the same group.
Why does tree testing remove visual design?
Show answer
To isolate the quality of the structure and labels from layout and visual cues.
In the tree test example, why could the trees not be distinguished on the day-pass task?
Show answer
Both had similar success, and with 40 participants the confidence intervals overlapped heavily.
Lesson quiz · 5 questions
Score 60% or more to complete this lesson.
Create a free account to save your progress, take quizzes and earn a certificate.