
CMPUT-421 · Lesson 3 of 12 · 35 min
Motor performance and predictive models
Some aspects of human performance are regular enough to model mathematically, and those models let designers compare interface options with a calculator before building anything. This lesson covers the most important of them: Fitts's law for pointing, the steering law for moving along a path, and the GOMS family, especially the keystroke-level model, for predicting the time an expert takes to complete a routine task. It also covers the practical consequences for target sizes on desktops and touch screens. ROB-430 applies Fitts's law to robot control panels; here the emphasis is on derivation, measurement and use in comparing designs.
Fitts's law
In 1954, the psychologist Paul Fitts asked participants to tap back and forth between two metal plates as quickly as possible, varying the distance between the plates and their width. Movement time increased with distance and decreased with width, and the relationship was remarkably consistent. Fitts expressed difficulty as an index of difficulty in bits, borrowing from Claude Shannon's information theory. The form now standard in HCI, proposed by Scott MacKenzie in 1992 and called the Shannon formulation, is
where MT is the movement time, D is the distance to the target center, W is the target width along the direction of motion, and a and b are constants fitted for a given device, person group and task. The intercept a absorbs reaction and click time; the slope b is the extra time per bit of difficulty, and 1/b is sometimes called the index of performance. The + 1 inside the logarithm keeps ID non-negative and fits data better than Fitts's original \(\log_2(2D/W)\).
Why a logarithm? One classic explanation is the iterative corrections model of Crossman and Goodeve (1963). Suppose an aimed movement is a sequence of submovements, each taking a fixed time t and each covering a fixed proportion of the remaining distance, leaving an error that is a fraction \(\epsilon\) of the distance at the start of the submovement. After n submovements the remaining distance is \(D\epsilon^n\), and the movement ends when this is within half the target width: \(D\epsilon^n \le W/2\). Solving for n gives \(n \ge \log_2(2D/W) / \log_2(1/\epsilon)\), so the total time \(nt\) is proportional to \(\log_2(2D/W)\). Later work, notably the stochastic optimized-submovement model of David Meyer and colleagues (1988), refined this picture by treating a movement as a fast primary submovement followed, if needed, by a corrective one, with noise proportional to velocity. Both explanations predict the logarithmic form.
Real pointing is not perfectly accurate: participants trade speed for accuracy, and some miss. To compare devices fairly, ISO 9241-411 recommends replacing the nominal width W with an effective width \(W_e = 4.133\,\sigma\), where \(\sigma\) is the standard deviation of endpoints along the axis of movement. The constant comes from assuming normally distributed endpoints: a width of 4.133 standard deviations captures 96 percent of them, matching a 4 percent error rate. The effective index of difficulty \(ID_e = \log_2(D/W_e + 1)\) then gives a throughput \(TP = ID_e / MT\) in bits per second, a single figure that combines speed and accuracy. Typical mouse throughputs reported in the literature are around 4 to 5 bits per second; touchpads and trackballs are lower, and direct touch on a screen is often higher for large targets.
# Fitts's law with the Shannon formulation, fitted to simulated pointing trials, and
# throughput computed the ISO 9241-411 way using the effective width We = 4.133 * SD of endpoints.
import math, random, statistics as st
random.seed(421)
a_true, b_true = 0.10, 0.15                       # seconds, seconds per bit (illustrative mouse values)
conds = [(d, w) for d in (128, 256, 512) for w in (16, 32, 64)]   # distance and width in pixels
rows = []
for d, w in conds:
    ID = math.log2(d / w + 1)
    times = [a_true + b_true * ID + random.gauss(0, 0.05) for _ in range(30)]
    ends = [random.gauss(0, w / 4.133) for _ in range(30)]        # endpoint scatter along the axis
    We = 4.133 * st.stdev(ends)
    IDe = math.log2(d / We + 1)
    rows.append((d, w, ID, IDe, st.mean(times)))
xs = [r[2] for r in rows]; ys = [r[4] for r in rows]
mx, my = st.mean(xs), st.mean(ys)
b = sum((x - mx) * (y - my) for x, y in zip(xs, ys)) / sum((x - mx) ** 2 for x in xs)
a = my - b * mx
r2 = 1 - sum((y - a - b * x) ** 2 for x, y in zip(xs, ys)) / sum((y - my) ** 2 for y in ys)
print(" D    W    ID   IDe   MT(s)")
for d, w, ID, IDe, mt in rows:
    print(f"{d:3} {w:4} {ID:5.2f} {IDe:5.2f} {mt:6.3f}")
print(f"regression: MT = {a:.3f} + {b:.3f} * ID   (R^2 = {r2:.3f})")
tp = st.mean(r[3] / r[4] for r in rows)
print(f"throughput (mean of IDe / MT over conditions): {tp:.2f} bits/s")D W ID IDe MT(s) 128 16 3.17 3.02 0.570 128 32 2.32 2.55 0.449 128 64 1.58 1.53 0.343 256 16 4.09 3.88 0.698 256 32 3.17 3.79 0.579 256 64 2.32 2.54 0.450 512 16 5.04 4.70 0.863 512 32 4.09 4.32 0.731 512 64 3.17 3.22 0.579 regression: MT = 0.100 + 0.151 * ID (R^2 = 0.997) throughput (mean of IDe / MT over conditions): 5.57 bits/s
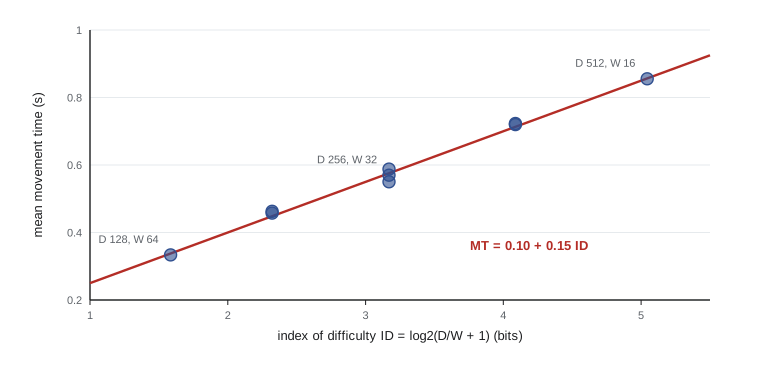
The fit recovers the generating constants, and the R squared near 1 is typical of real Fitts's law studies when each point averages many trials. The simulated endpoint scatter was set so that the effective width roughly equals the nominal width, so ID and IDe are similar; in a real study, participants who are told to hurry produce wider scatter, a larger We, a smaller IDe and a throughput that properly penalizes their errors.
Design consequences of Fitts's law
Fitts's law explains several design practices. Big targets are faster to hit, so frequently used controls should be large. Near targets are faster, so related actions should be placed close to where the pointer or finger already is, and pop-up menus that appear at the pointer are faster than menu bars far away. Edges and corners of a screen behave as targets of effectively infinite size for a mouse, because the pointer stops at the edge; this is why menu bars along the top edge (as on macOS) and controls in screen corners are fast. Linear menus get slower toward the bottom because items are farther away, while pie menus, which place items in a circle at equal distance from the pointer, equalize distance.
Fitts's law also has limits. It describes rapid aimed movements to a visible target and does not include the time to find the target (visual search, lesson 2), to decide what to do (Hick–Hyman), or to recover from errors. It applies to one-dimensional width; for two-dimensional targets, the smaller of width and height, or the width measured along the approach angle, is commonly used. And it predicts time, not comfort: a large target in an awkward place may be fast but tiring.
Touch targets
On touch screens, the finger hides the target and its contact area is large and imprecise, the so-called fat finger problem. Platform guidelines therefore set minimum target sizes: Apple's Human Interface Guidelines recommend at least 44 by 44 points, and Google's Material Design recommends at least 48 by 48 density-independent pixels, which is roughly 9 millimeters on a typical screen. WCAG 2.2 added success criterion 2.5.8, target size (minimum), at level AA: pointer targets must be at least 24 by 24 CSS pixels, or have enough spacing that a 24-pixel circle centered on each does not overlap its neighbors, with exceptions such as inline links in text. The older level AAA criterion 2.5.5 asks for 44 by 44 CSS pixels. Larger targets help everyone, and especially people with tremor, limited dexterity or who use phones while walking or on a moving bus.
Where a phone is held matters too. Studies of grip by Steven Hoober and others found that most people use phones one-handed with the thumb much of the time, and the region the thumb reaches comfortably depends on hand size, phone size and which hand is used. Primary actions placed at the bottom of the screen, as with bottom navigation bars, are easier to reach than controls in the top corners. RideLine's redesign moves the 'Plan trip' and 'Buy fare' actions from a top bar into a bottom bar.
The steering law
Some tasks require moving along a constrained path rather than to a point: navigating cascading menus, dragging a slider, drawing along a line. Johnny Accot and Shumin Zhai (1997) derived the steering law, which for a straight tunnel of length A and width W is
Time grows linearly with the ratio of length to width, not logarithmically, which makes long narrow paths much more expensive than long jumps to big targets. Cascading menus, where the pointer must stay inside a narrow item while moving sideways to a submenu, are a classic steering problem. Designers mitigate it by making submenu items taller, adding a delay before a submenu closes, or computing a safe triangle toward the submenu within which diagonal movement does not close it, a technique popularized by Amazon's mega-menus.
GOMS and the keystroke-level model
Card, Moran and Newell's GOMS framework describes skilled, routine behavior in terms of Goals, Operators (elementary perceptual, motor or cognitive actions), Methods (sequences of operators that accomplish goals) and Selection rules (which method to use when more than one applies). A GOMS analysis decomposes a task into a hierarchy of goals and methods and can predict execution time, learning time (roughly proportional to the number of distinct methods) and the effect of design changes. Variants include the detailed CPM-GOMS (critical path method), which models parallel perceptual, cognitive and motor activity, and NGOMSL (David Kieras), a structured notation.
The simplest member, the keystroke-level model (KLM, 1980), predicts the time an expert takes to perform a task without errors by adding up the times of elementary operators. The commonly used values are:
| Operator | Meaning | Typical time |
|---|---|---|
| K | Press a key or button (average non-secretarial typist) | 0.28 s (0.12 s for a good typist, 1.2 s for an unfamiliar keyboard) |
| P | Point with a mouse to a target | 1.1 s (or compute from Fitts's law) |
| B | Press or release a mouse button (a click is BB) | 0.1 s |
| H | Move the hand between keyboard and mouse | 0.4 s |
| M | Mentally prepare for the next step | 1.35 s |
| R(t) | Wait for the system to respond | t seconds, if the user must wait |
The difficult part of KLM is placing the M operators. The original rules place an M before most physical actions that begin a new cognitive unit, such as before pointing to a command or typing a new string, and then delete M operators that are anticipated within a unit, such as between pointing and clicking, or between keystrokes of a familiar word. Different analysts placing M operators slightly differently is the main source of variation in KLM predictions; published validations found predictions typically within about 20 percent of measured expert times, which is good enough to rank alternative designs.
The program below uses KLM to compare RideLine's old and redesigned flows for buying a day pass on the web, assuming a familiar user with a saved card.
# Keystroke-level model (Card, Moran and Newell): predict expert, error-free task time
# for two versions of "buy a day pass" in the RideLine web app.
OPS = {"K": 0.28, "P": 1.10, "B": 0.10, "H": 0.40, "M": 1.35}   # K for an average typist
def klm(seq, responses=0.0):
    t = sum(OPS[c] for c in seq.replace(" ", ""))
    return t + responses
# old design: open menu, choose Fares, choose Passes, pick Day pass from a list,
# type quantity, open payment, choose saved card, confirm (B = press or release, so a click is BB)
old = ("H M P BB" " M P BB" " M P BB" " M P BB"      # home -> menu -> Fares -> Passes -> Day pass
       " P BB H M KK"                                # click quantity box, type "1" and Tab
       " H M P BB" " M P BB" " M P BB")              # Payment -> saved card -> Confirm
# new design: a "Day pass" shortcut on the home screen, saved card preselected
new = "H M P BB" " M P BB"                            # tap Day pass -> confirm
t_old = klm(old, responses=6 * 0.5)                   # six page loads of about 0.5 s
t_new = klm(new, responses=2 * 0.5)
print(f"old design: {old.count('M')} M, {old.count('P')} P, {old.count('B')} B, {old.count('K')} K -> {t_old:.2f} s")
print(f"new design: {new.count('M')} M, {new.count('P')} P, {new.count('B')} B -> {t_new:.2f} s")
print(f"predicted saving per purchase: {t_old - t_new:.2f} s ({1 - t_new / t_old:.0%})")
riders = 40000                                        # invented daily pass purchases
print(f"time saved per day across {riders} purchases: {(t_old - t_new) * riders / 3600:.0f} hours")old design: 8 M, 8 P, 16 B, 2 K -> 25.96 s new design: 2 M, 2 P, 4 B -> 6.70 s predicted saving per purchase: 19.26 s (74%) time saved per day across 40000 purchases: 214 hours
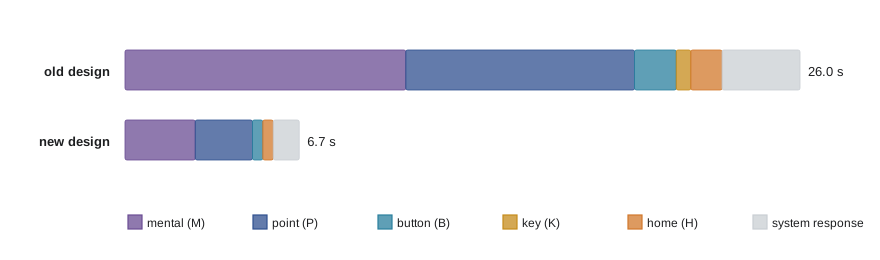
The redesign removes four navigation levels and the quantity field, cutting the predicted time by about three quarters. Most of the saving comes from fewer M and P operators: fewer decisions and fewer targets. The numbers should not be over-read. KLM assumes an expert who makes no errors and knows exactly what to do, so it says nothing about learnability or about the visitor who does not know what a day pass is. Its value is in comparing designs consistently and in showing where time goes. Multiplied across tens of thousands of daily purchases, even small per-task savings add up to many hours of riders' time, an argument that often persuades managers more than usability principles do.
KLM has been adapted to new interaction styles. Researchers have proposed operator values for touch screens (for example, a tap operator and gestures such as swipes and pinches in the touch-level model of Rice and Lartigue, 2014), for mobile phones and for in-vehicle systems. The method stays the same: decompose the task, assign operator times, sum, and use the result to compare alternatives. Tools such as CogTool (from Bonnie John's group at Carnegie Mellon) automated KLM predictions from storyboards.
Models and their place
Predictive models are sometimes dismissed as relics of an era of expert office workers. That is a mistake. They are cheap, they need no participants, and they force the analyst to spell out exactly what a task requires. They are most useful early, to compare a handful of design options, and in domains where expert speed matters greatly, such as call centers, point-of-sale terminals, air traffic control and data entry; a famous 1990s study by Wayne Gray, Bonnie John and Michael Atwood used CPM-GOMS to predict, correctly, that a new telephone operator workstation would be slower than the old one, potentially saving a telephone company millions of dollars. They are least useful for novel tasks, for learning and exploration, and for questions of satisfaction, where empirical methods (lessons 5 and 9) are needed.
Worked examples
Worked problem
Fitts's law comparison
A RideLine button is 300 pixels from the user\'s thumb and 40 pixels wide. With a = 0.05 s and b = 0.12 s per bit, what is the predicted movement time, and what happens if the button is made 80 pixels wide?
Show solution
- ID at 40 px: \(\log_2(300/40 + 1) = \log_2 8.5 \approx 3.09\) bits; MT \(\approx 0.05 + 0.12 \times 3.09 = 0.42\) s.
- ID at 80 px: \(\log_2(300/80 + 1) = \log_2 4.75 \approx 2.25\) bits; MT \(\approx 0.05 + 0.12 \times 2.25 = 0.32\) s.
- Doubling the width removes nearly 1 bit and about 0.1 s.
Answer: About 0.42 s at 40 px and 0.32 s at 80 px; doubling width removes about one bit of difficulty.
Worked problem
Throughput from effective width
In a condition with D = 400 px, participants\' endpoints have a standard deviation of 12 px along the axis and the mean movement time is 0.70 s. Compute the effective width, IDe and throughput.
Show solution
- \(W_e = 4.133 \times 12 \approx 49.6\) px.
- \(ID_e = \log_2(400/49.6 + 1) = \log_2 9.06 \approx 3.18\) bits.
- \(TP = 3.18 / 0.70 \approx 4.5\) bits/s.
Answer: We is about 50 px, IDe about 3.2 bits and throughput about 4.5 bits per second, typical of a mouse.
Worked problem
A KLM estimate
A user with hands on the keyboard must select a field with the mouse and type a 4-digit stop number, then press Enter. Write the KLM sequence and estimate the time with K = 0.28 s.
Show solution
- Move hand to mouse (H), prepare (M), point to the field (P), click (BB).
- Move hand back to keyboard (H), prepare (M), type 4 digits (KKKK), press Enter (K).
- Time: H + M + P + BB + H + M + 5K = 0.4 + 1.35 + 1.1 + 0.2 + 0.4 + 1.35 + 1.4 = 6.2 s.
Answer: About 6.2 s; most of it is mental preparation, pointing and homing, so keyboard focus on the field would save about 3.5 s.
Common mistakes
MistakeUse the nominal target width when comparing devices whose users make different numbers of errors.
InsteadUse the effective width from endpoint scatter (ISO 9241-411) so throughput accounts for accuracy.
MistakeFitts's law predicts total task time.
InsteadIt predicts the aimed movement only; search, decision, waiting and error recovery must be added.
MistakeA 30-pixel touch target is fine because the icon is clear.
InsteadTouch targets should meet platform guidance (about 44–48 points or dp) and at least the WCAG 2.2 minimum of 24 CSS pixels.
MistakeKLM predicts how long new users take.
InsteadKLM models expert, error-free performance; learnability needs other methods.
MistakePut frequently used actions in the top corners of a phone screen because corners are fast.
InsteadCorners are fast for a mouse because the pointer stops at the edge; on a phone held one-handed, top corners are hard for the thumb to reach.
Summary and key terms
- Fitts's law: MT = a + b log2(D/W + 1); movement time grows with the logarithm of distance over width.
- The iterative corrections and optimized-submovement models explain the logarithmic form.
- ISO 9241-411 throughput uses the effective width We = 4.133 times the endpoint standard deviation, combining speed and accuracy.
- Large, near targets and screen edges are fast for a mouse; touch targets need at least about 44–48 points or dp, and WCAG 2.2 sets a 24 CSS pixel minimum.
- The steering law predicts that time along a constrained path grows linearly with length over width.
- GOMS describes skilled tasks as goals, operators, methods and selection rules.
- The keystroke-level model sums operator times (K, P, B, H, M, R) to predict expert, error-free task time and compare designs.
- Fitts's law
- A model predicting that aimed movement time grows with the logarithm of distance over target width.
- Index of difficulty
- The quantity log2(D/W + 1), measured in bits, that sets pointing difficulty.
- Effective width
- A target width computed from the spread of actual endpoints, 4.133 times their standard deviation.
- Throughput
- Effective index of difficulty divided by movement time, in bits per second.
- Steering law
- A model predicting that time to move through a tunnel grows linearly with its length divided by its width.
- GOMS
- A framework modeling skilled tasks as goals, operators, methods and selection rules.
- Keystroke-level model
- A GOMS variant predicting expert task time by summing standard operator times.
- Mental operator
- The KLM operator M, about 1.35 s, representing preparation for the next step.
- Fat finger problem
- The imprecision of touch input caused by the size of the finger and its occlusion of the target.
- Target size minimum
- WCAG 2.2 success criterion 2.5.8 requiring pointer targets of at least 24 by 24 CSS pixels or equivalent spacing.
Practice problems
Work each problem on paper first, then reveal the answer to check.
Write Fitts's law in the Shannon formulation.
Show answer
MT = a + b log2(D/W + 1).
What is the index of difficulty for D = 210 px and W = 30 px?
Show answer
log2(8) = 3 bits.
Why is a menu bar along the top screen edge fast to reach with a mouse?
Show answer
The pointer stops at the edge, so the target is effectively infinitely tall.
What constant converts endpoint standard deviation to effective width, and why?
Show answer
4.133, because ±2.066 standard deviations contain about 96 percent of a normal distribution.
How does time grow in the steering law?
Show answer
Linearly with the ratio of path length to width.
What do the letters G, O, M and S stand for?
Show answer
Goals, operators, methods and selection rules.
Give the KLM times for K (average typist), P, H and M.
Show answer
About 0.28 s, 1.1 s, 0.4 s and 1.35 s.
Why do KLM predictions vary between analysts?
Show answer
Mainly because analysts place mental operators differently.
What is the WCAG 2.2 minimum target size at level AA?
Show answer
24 by 24 CSS pixels, or equivalent spacing, with exceptions.
Name one situation where KLM is a poor tool.
Show answer
Novel tasks or first-time use, where learning and errors dominate.
Lesson quiz · 5 questions
Score 60% or more to complete this lesson.
Create a free account to save your progress, take quizzes and earn a certificate.