
CMPUT-404 · Lesson 11 of 12 · 40 min
Deployment, operations and scaling
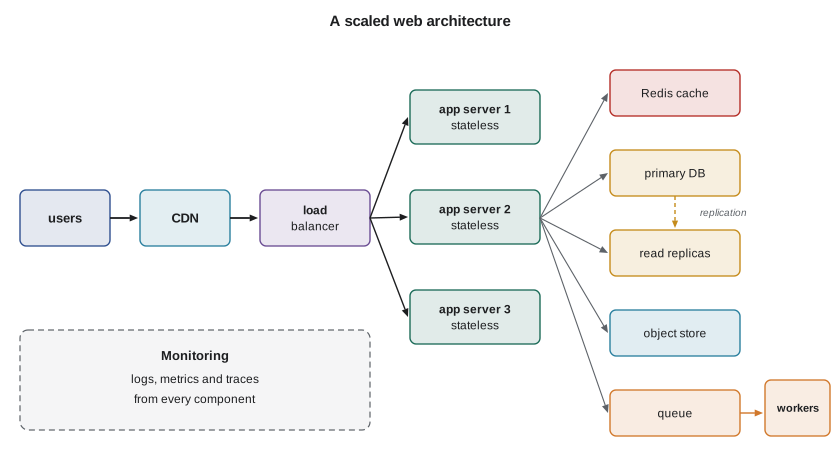
An application is only useful once it runs reliably for real users. This lesson follows the booking application from a developer's laptop to production: packaging it in a container, configuring it through the environment, putting a reverse proxy in front, deploying without downtime, and then scaling it as traffic grows with load balancing, caching, database replicas and shards, and background queues. It ends with observability, the logs, metrics and traces that tell operators what is happening. Distributed systems theory, including consensus and the CAP theorem, is covered in CMPUT-450; network-level load balancing and CDNs appear in CMPUT-313. Here the focus is on what a web developer configures and decides.
The twelve-factor app
The twelve-factor methodology, written by engineers at the Heroku platform in 2011, remains a useful checklist for applications that deploy cleanly. Among its factors: keep one codebase in version control with many deployments; declare dependencies explicitly in a lock file; store configuration in the environment, never in code; treat backing services such as databases and caches as attached resources identified by URLs; separate build, release and run stages; run the application as stateless processes, keeping session and file data in backing services; export services by binding to a port; scale out by running more processes; make processes start fast and shut down gracefully; keep development and production as similar as possible; treat logs as event streams written to standard output; and run administrative tasks such as migrations as one-off processes.
# Twelve-factor configuration: read settings from the environment, validate them at start-up, fail fast.
import os

def load_config(env):
    required = ["DATABASE_URL", "SESSION_SECRET"]
    missing = [k for k in required if not env.get(k)]
    if missing:
        raise SystemExit(f"configuration error: missing {', '.join(missing)}")
    if len(env["SESSION_SECRET"]) < 32:
        raise SystemExit("configuration error: SESSION_SECRET must be at least 32 characters")
    return {
        "database_url": env["DATABASE_URL"],
        "debug": env.get("DEBUG", "false").lower() == "true",
        "workers": int(env.get("WEB_CONCURRENCY", "4")),
        "log_level": env.get("LOG_LEVEL", "info"),
    }

def redact(cfg):                                 # never log secrets or credentials
    return {k: ("***" if "url" in k or "secret" in k else v) for k, v in cfg.items()}

staging = {"DATABASE_URL": "postgres://app:pw@db.staging:5432/booking", "SESSION_SECRET": "s" * 40, "WEB_CONCURRENCY": "2"}
print("staging:", redact(load_config(staging)))
try:
    load_config({"DATABASE_URL": "postgres://app:pw@db.prod:5432/booking"})
except SystemExit as e:
print("production without secret ->", e)staging: {'database_url': '***', 'debug': False, 'workers': 2, 'log_level': 'info'}
production without secret -> configuration error: missing SESSION_SECRETFailing fast at start-up with a clear message is much better than failing on the first request that needs the missing setting. Note the redaction: configuration often contains credentials, so it must never be logged in full. Statelessness is the factor with the largest consequences for scaling: if any server can handle any request, adding servers adds capacity, and a crashed server loses nothing.
Containers
A container packages an application with its runtime and libraries into an image that runs the same way on a laptop, a test server and production. Docker popularized the format, now standardized by the Open Container Initiative. A Dockerfile lists the steps to build an image; each step creates a cached layer, so dependencies are installed before the application code is copied, and changing code does not reinstall packages. Multi-stage builds keep compilers and build tools out of the final image, making it smaller and reducing its attack surface, and the application should run as an unprivileged user.
# Dockerfile for the booking application (listing). Multi-stage: build tools stay out of the final image.
FROM python:3.12-slim AS build
WORKDIR /app
COPY requirements.txt .
RUN pip install --no-cache-dir --prefix=/install -r requirements.txt

FROM python:3.12-slim
RUN useradd --create-home --uid 10001 app          # never run as root
WORKDIR /app
COPY --from=build /install /usr/local
COPY --chown=app:app . .
USER app
ENV PYTHONUNBUFFERED=1                              # logs go straight to stdout
EXPOSE 8000
HEALTHCHECK CMD python -c "import urllib.request; urllib.request.urlopen('http://127.0.0.1:8000/healthz')"
CMD ["gunicorn", "--bind", "0.0.0.0:8000", "--workers", "4", "booking.wsgi:app"]
Orchestrators run many containers across many machines. Kubernetes is the dominant one: it schedules containers onto nodes, restarts failed ones, scales replicas, performs rolling updates and routes traffic to healthy instances using readiness and liveness checks. Managed platforms such as Google Cloud Run, AWS App Runner, Azure Container Apps, Fly.io and Render run containers without managing clusters. Serverless functions (AWS Lambda, Cloudflare Workers, Vercel functions) go further, running code per request and scaling to zero, at the cost of cold starts and limits on run time. Many sites, including this one, run happily on a single traditional server with PHP and MariaDB; choose the simplest platform that meets your reliability needs.
Reverse proxies and load balancers
Production web applications usually sit behind a reverse proxy such as nginx, Caddy, HAProxy or a cloud load balancer. It terminates TLS, serves static files directly, compresses responses, enforces rate limits and request size limits, and distributes requests among several application servers. Because the proxy forwards requests, it passes the original client address and scheme in headers such as X-Forwarded-For and X-Forwarded-Proto; the application must trust these headers only when they come from its own proxy.
# nginx as TLS terminator, static file server, load balancer and rate limiter (listing).
limit_req_zone $binary_remote_addr zone=login:10m rate=10r/m;

upstream booking_app {
    least_conn;                                  # send each request to the least busy server
    server 10.0.1.11:8000 max_fails=3 fail_timeout=10s;
    server 10.0.1.12:8000 max_fails=3 fail_timeout=10s;
    server 10.0.1.13:8000 max_fails=3 fail_timeout=10s;
}
server {
    listen 443 ssl;
    http2 on;
    server_name booking.example.ca;
    ssl_certificate     /etc/letsencrypt/live/booking.example.ca/fullchain.pem;
    ssl_certificate_key /etc/letsencrypt/live/booking.example.ca/privkey.pem;
    server_tokens off;                           # hide the nginx version
    add_header Strict-Transport-Security "max-age=63072000; includeSubDomains" always;
    gzip on; gzip_types text/css application/javascript application/json image/svg+xml;

    location /static/ { root /srv/booking; expires 1y; add_header Cache-Control "public, immutable"; }
    location = /login { limit_req zone=login burst=5 nodelay; proxy_pass http://booking_app; }
    location / {
        proxy_pass http://booking_app;
        proxy_set_header Host $host;
        proxy_set_header X-Forwarded-For $proxy_add_x_forwarded_for;
        proxy_set_header X-Forwarded-Proto $scheme;
        proxy_set_header X-Request-ID $request_id;   # one id to trace a request through every log
    }
}
The choice of load-balancing algorithm matters when servers or requests are uneven. Round robin sends requests to servers in turn, regardless of how busy they are. Least connections sends each request to the server with the fewest requests in progress, naturally steering work away from a slow or overloaded server. The seeded simulation below runs the same arrivals against three servers, one of which is 2.5 times slower, perhaps because it shares hardware with a noisy neighbor.
# Load balancing simulation: round robin versus least connections, with one slow server. Seeded.
import random

def simulate(policy, seed=404, n=20000, speeds=(1.0, 1.0, 0.4), workers=2, rate=2.2):
    rng = random.Random(seed)
    free_at = [[0.0] * workers for _ in speeds]          # when each worker on each server becomes free
    finishes = [[] for _ in speeds]                       # finish times of requests assigned to each server
    t, rr, lat = 0.0, 0, []
    for _ in range(n):
        t += rng.expovariate(rate)                        # Poisson arrivals, 2.2 requests/s on average
        if policy == "round robin":
            s = rr % len(speeds); rr += 1
        else:                                             # least connections: fewest requests in progress
            s = min(range(len(speeds)), key=lambda i: (sum(f > t for f in finishes[i][-50:]), i))
        w = min(range(workers), key=lambda j: free_at[s][j])
        start = max(t, free_at[s][w])                     # wait in the server's queue if all workers busy
        finish = start + rng.expovariate(1.0) / speeds[s] # mean 1 s normally, 2.5 s on the slow server
        free_at[s][w] = finish; finishes[s].append(finish); lat.append(finish - t)
    lat.sort()
    pct = lambda p: lat[int(p * n) - 1]
    share = [len(f) / n for f in finishes]
    return sum(lat) / n, pct(0.5), pct(0.95), pct(0.99), share

for policy in ("round robin", "least connections"):
    mean, p50, p95, p99, share = simulate(policy)
    print(f"{policy:18s} mean {mean:5.2f} s  p50 {p50:4.2f} s  p95 {p95:5.2f} s  p99 {p99:5.2f} s  "
f"slow server got {share[2]:.0%} of requests")round robin mean 3.96 s p50 1.28 s p95 18.44 s p99 29.35 s slow server got 33% of requests least connections mean 1.26 s p50 0.81 s p95 3.89 s p99 7.04 s slow server got 15% of requests
Under round robin the slow server receives a third of the traffic it cannot handle, and its queue makes the tail latency much worse; least connections notices the growing queue and sends it fewer requests. The difference shows most at the 95th and 99th percentiles, which is why latency is reported as percentiles (lesson 6). Other algorithms include weighted round robin, random choice of two servers picking the less loaded (the power of two choices), and consistent hashing when requests for the same key should reach the same server.
Deploying without downtime
Users should not notice deployments. In a rolling deployment, servers are replaced a few at a time, each removed from the load balancer, upgraded, health-checked and returned, so capacity never drops to zero; during the roll, old and new versions run side by side, which is why lesson 8's expand-and-contract migrations matter. Blue-green deployment runs a complete new environment beside the old one and switches traffic at once, allowing instant rollback. Canary releases send a small percentage of traffic to the new version first and watch error rates before continuing. Feature flags separate deploying code from releasing a feature, so incomplete work can ship turned off. Continuous integration and delivery pipelines (CMPUT-301) automate the tests, image build, migrations and rollout, so every deployment follows the same audited steps.
Caching for scale
Caching appears at every layer: the browser cache and CDN (lesson 6), a reverse-proxy cache, an application cache in Redis or Memcached holding rendered fragments or query results, and the database's own buffer cache. The key measure is the hit ratio, the fraction of requests served from the cache. Because web traffic is usually skewed, with a small number of popular pages receiving most requests, a cache holding a small fraction of all items can serve most requests.
# Cache hit ratio: an LRU cache in front of a database, with skewed (Zipf-like) popularity. Seeded.
import random
from collections import OrderedDict

def run(capacity, requests, keys=10000, s=1.0, seed=404):
    rng = random.Random(seed)
    weights = [1 / (k + 1) ** s for k in range(keys)]     # a few pages are very popular
    cache, hits = OrderedDict(), 0
    for key in rng.choices(range(keys), weights, k=requests):
        if key in cache:
            hits += 1; cache.move_to_end(key)
        else:
            cache[key] = True
            if len(cache) > capacity: cache.popitem(last=False)   # evict least recently used
    return hits / requests

DB_MS, CACHE_MS = 20.0, 0.5
for cap in (100, 500, 1000, 5000):
    h = run(cap, 100000)
    avg = h * CACHE_MS + (1 - h) * DB_MS
    print(f"cache {cap:5d} entries ({cap / 100:4.0f}% of keys): hit ratio {h:5.1%}  "
f"avg latency {avg:5.2f} ms database load {1 - h:5.1%}")cache 100 entries ( 1% of keys): hit ratio 39.0% avg latency 12.40 ms database load 61.0% cache 500 entries ( 5% of keys): hit ratio 58.5% avg latency 8.60 ms database load 41.5% cache 1000 entries ( 10% of keys): hit ratio 67.2% avg latency 6.89 ms database load 32.8% cache 5000 entries ( 50% of keys): hit ratio 87.3% avg latency 2.97 ms database load 12.7%
With skewed popularity, a cache holding 5% of the keys serves more than half of the requests, cutting the database's load by the same proportion; diminishing returns set in as capacity grows. The hardest part of caching is invalidation: when data changes, cached copies must be updated or expire. Common strategies are short time-to-live values, deleting the cache entry whenever the underlying row is written (cache-aside), and versioned keys. When a popular entry expires, many requests may hit the database at once (a cache stampede); a lock or early background refresh prevents it.
Scaling the database
Stateless application servers scale out easily; the database is usually the hard part. The first steps are the cheap ones: add indexes, fix N+1 queries (lesson 8), add caching, and move to a larger server (vertical scaling). Read replicas copy the primary database's changes asynchronously and serve read queries, which suits read-heavy web applications; the catch is replication lag, so a user who has just made a booking might not see it if the next read goes to a replica, and applications send a user's reads to the primary briefly after a write. Sharding partitions data across several databases by a key, such as user or region, so each shard holds a fraction of the data and load. Consistent hashing assigns keys to shards so that adding a shard moves only a small fraction of keys.
# Sharding with consistent hashing: adding a shard moves only a fraction of keys.
import bisect, hashlib

def h(s): return int(hashlib.sha256(s.encode()).hexdigest()[:12], 16)

class Ring:
    def __init__(self, shards, vnodes=100):
        self.points = sorted((h(f"{s}#{v}"), s) for s in shards for v in range(vnodes))
        self.keys = [p for p, _ in self.points]
    def shard(self, key):
        i = bisect.bisect(self.keys, h(key)) % len(self.points)
        return self.points[i][1]

users = [f"user-{i}" for i in range(30000)]
before = Ring(["db-a", "db-b", "db-c"]); after = Ring(["db-a", "db-b", "db-c", "db-d"])
counts = {}
for u in users: counts[before.shard(u)] = counts.get(before.shard(u), 0) + 1
moved = sum(before.shard(u) != after.shard(u) for u in users)
print("3 shards, keys per shard:", dict(sorted(counts.items())))
print(f"add db-d: consistent hashing moves {moved / len(users):.1%} of keys (ideal 25%)")
naive = sum(h(u) % 3 != h(u) % 4 for u in users)
print(f"add db-d: hash mod N would move {naive / len(users):.1%} of keys")3 shards, keys per shard: {'db-a': 9764, 'db-b': 8930, 'db-c': 11306}
add db-d: consistent hashing moves 26.3% of keys (ideal 25%)
add db-d: hash mod N would move 75.0% of keysSharding brings real costs: queries across shards, transactions spanning shards and rebalancing all become harder, so it is usually a last resort after caching and replicas. Distributed SQL databases such as CockroachDB and Google Spanner, and managed services such as Vitess for MySQL, automate parts of it. When data is replicated across machines that can lose contact, a system must choose between staying available and staying consistent during the partition, the trade-off formalized by the CAP theorem and explored in CMPUT-450.
Queues and background work
Slow or unreliable work does not belong inside a web request: sending email, generating PDFs, resizing images, calling a slow partner API. Instead, the request handler puts a job on a queue, such as Redis with Celery or RQ, RabbitMQ, Amazon SQS or Kafka, and responds immediately, while worker processes take jobs from the queue. Queues absorb bursts, isolate failures, and let workers scale separately from web servers. Jobs should be idempotent, because queues usually deliver at least once, and failed jobs need retries with backoff and a dead-letter queue for inspection.
# A background job queue absorbs bursts: requests return at once, workers catch up. Seeded.
import random
rng = random.Random(404)
arrivals = [0] * 60
for minute in range(60):                                    # emails to send per minute
    arrivals[minute] = rng.randint(20, 40) + (400 if minute == 10 else 0)   # a burst when bookings open

workers, per_worker = 4, 30                                 # each worker sends 30 emails per minute
backlog, peak, peak_at, history = 0, 0, 0, []
for minute, n in enumerate(arrivals):
    backlog = max(0, backlog + n - workers * per_worker)
    history.append(backlog)
    if backlog > peak: peak, peak_at = backlog, minute
drained = next(m for m in range(peak_at, 60) if history[m] == 0)
print(f"total jobs {sum(arrivals)}, capacity {workers * per_worker}/min")
print(f"peak backlog {peak} jobs at minute {peak_at}; queue empty again by minute {drained}")
print(f"an email queued at the peak waits about {peak / (workers * per_worker):.1f} min; "
f"every booking request still returned immediately")total jobs 2147, capacity 120/min peak backlog 303 jobs at minute 10; queue empty again by minute 14 an email queued at the peak waits about 2.5 min; every booking request still returned immediately
The burst at minute 10 is more than three times what the workers can send in a minute, yet no web request waits for it: each booking returns as soon as its job is queued, the backlog peaks and drains within a few minutes, and the delay falls on confirmation emails, where a short wait is acceptable. Monitoring the backlog's size and age tells operators when to add workers; autoscaling can do so automatically.
Observability
Once an application runs on many machines, operators need ways to see inside it. Observability rests on three kinds of telemetry. Logs record individual events; structured logs in JSON with a request identifier can be searched and correlated across services. Metrics are numeric time series such as request rate, error rate and latency percentiles, cheap to store and ideal for dashboards and alerts; for each service, the RED method tracks rate, errors and duration. Traces follow a single request through every service it touches, showing where time is spent; OpenTelemetry is the vendor-neutral standard for producing all three. Alerts should fire on symptoms users feel, such as high error rates or slow responses, rather than on every internal cause.
# Observability: structured logs, latency percentiles, and an SLO error budget.
import json, random
rng = random.Random(404)

def log(level="info", **fields):                          # one JSON object per line, easy to search
    print(json.dumps({"ts": "2026-11-02T14:03:07Z", "level": level, **fields}, sort_keys=True))

log(msg="request", method="POST", path="/v1/bookings", status=201, ms=48, request_id="b7e1c2")
log("error", msg="request", method="GET", path="/v1/rooms", status=500, ms=3012, request_id="c91d07", error="db timeout")

lat = sorted(rng.lognormvariate(4.0, 0.5) for _ in range(10000))     # milliseconds
print("latency p50 %.0f ms, p95 %.0f ms, p99 %.0f ms, max %.0f ms" %
      (lat[4999], lat[9499], lat[9899], lat[-1]))

slo = 0.999                                               # 99.9% of requests succeed, over 30 days
monthly = 30 * 24 * 3600 * 50                             # 50 requests per second
budget = (1 - slo) * monthly
failed_so_far = 61_000
print(f"error budget: {budget:,.0f} failed requests per 30 days; used {failed_so_far / budget:.0%}")
print(f"as downtime: {(1 - slo) * 30 * 24 * 60:.1f} minutes per 30 days"){"level": "info", "method": "POST", "ms": 48, "msg": "request", "path": "/v1/bookings", "request_id": "b7e1c2", "status": 201, "ts": "2026-11-02T14:03:07Z"}
{"error": "db timeout", "level": "error", "method": "GET", "ms": 3012, "msg": "request", "path": "/v1/rooms", "request_id": "c91d07", "status": 500, "ts": "2026-11-02T14:03:07Z"}
latency p50 54 ms, p95 123 ms, p99 172 ms, max 382 ms
error budget: 129,600 failed requests per 30 days; used 47%
as downtime: 43.2 minutes per 30 daysService level objectives (SLOs) make reliability a measurable target, such as 99.9% of requests succeeding within 30 days. The remaining 0.1% is the error budget: while budget remains, the team can ship features quickly; when it is spent, effort shifts to reliability. A 99.9% target allows about 43 minutes of complete downtime per month, and each additional nine costs far more than the last, so targets should match what users actually need. After incidents, blameless postmortems record what happened and what will change, focusing on systems rather than individuals.
Worked examples
Worked problem
Capacity planning with Little's law
The booking app must handle 300 requests per second at peak, each spending on average 120 ms in an application worker. How many concurrent workers are needed, and how many servers if each runs 16 workers at no more than 70% utilization?
Show solution
- Little's law: concurrency L = arrival rate λ × time in system W = 300 × 0.12 = 36 requests in progress on average.
- At 70% utilization, provision 36 / 0.7 ≈ 51.4, so 52 workers.
- 52 / 16 = 3.25, so 4 servers; add one more so the site survives losing a server (N+1).
Answer: About 52 workers: 4 servers, or 5 with a spare for failures.
Worked problem
Read-your-writes with replicas
After booking a room, a user is redirected to My bookings, which reads from a replica and sometimes does not show the new booking. Propose fixes.
Show solution
- Cause: replication lag; the replica has not yet applied the write.
- Option 1: route the user's reads to the primary for a few seconds after any write (store a timestamp in the session).
- Option 2: wait until the replica has reached the write's log position before reading, where the database supports it.
- Option 3: render the confirmation page from the data just written rather than re-reading it.
Answer: Read from the primary briefly after writes, or wait for the replica position.
Worked problem
Choosing what to scale first
Response times rose from 150 ms to 2 s as traffic doubled. Monitoring shows application CPU at 35%, database CPU at 95%, and one query running 4000 times per minute. What should be done first?
Show solution
- Application servers are not the bottleneck; adding them would not help and would add database connections.
- The database is saturated; inspect the frequent query with EXPLAIN and add an index if it scans.
- Cache its result if it is the same for many users, and check for N+1 patterns producing it.
- Only then consider read replicas or a larger database server.
Answer: Fix and cache the hot query before adding hardware; measure before scaling.
Common mistakes
MistakeStore uploaded files and sessions on the web server's disk.
InsteadKeep servers stateless; use object storage and a shared session store so any server can handle any request.
MistakePut secrets in the Dockerfile or image.
InsteadImages are copied and cached widely; inject secrets at run time from the environment or a secrets manager.
MistakeRound robin is always good enough.
InsteadWith uneven servers or requests, least connections or power-of-two choices give much better tail latency.
MistakeShard as soon as the database feels slow.
InsteadIndexes, query fixes, caching and replicas are cheaper; shard only when necessary.
MistakeSend email inside the request handler.
InsteadQueue it for a background worker so requests stay fast and failures can be retried.
MistakeAlert on every high CPU reading.
InsteadAlert on user-facing symptoms tied to SLOs, and investigate causes from dashboards.
Summary and key terms
- Twelve-factor apps keep configuration in the environment and run as stateless processes.
- Containers package applications reproducibly; orchestrators and platforms run them at scale.
- Reverse proxies terminate TLS, serve static files, rate-limit and balance load.
- Least connections handles uneven servers better than round robin, especially at the tail.
- Rolling, blue-green and canary deployments with compatible migrations avoid downtime.
- Caches, replicas, shards and queues each relieve one bottleneck while adding new problems.
- Logs, metrics and traces, guided by SLOs and error budgets, keep systems observable.
- Twelve-factor app
- A methodology for building portable, scalable web services.
- Container image
- A packaged application with its runtime, run identically anywhere.
- Reverse proxy
- A server in front of applications that forwards client requests to them.
- Least connections
- Load balancing to the server with the fewest active requests.
- Canary release
- Sending a small share of traffic to a new version before full rollout.
- Hit ratio
- The fraction of requests served from a cache.
- Read replica
- A database copy that applies the primary's changes and serves reads.
- Sharding
- Partitioning data across several databases by a key.
- Consistent hashing
- Mapping keys to nodes so that adding a node moves few keys.
- Error budget
- The amount of failure an SLO permits over a period.
Practice problems
Work each problem on paper first, then reveal the answer to check.
Why should configuration live in environment variables rather than code?
Show answer
So the same build can run in every environment and secrets stay out of version control.
What does a multi-stage Docker build achieve?
Show answer
A smaller final image without build tools, reducing size and attack surface.
In the load-balancing run, which policy had the better p99 latency and why?
Show answer
Least connections, because it sent fewer requests to the slow server whose queue was growing.
What is the difference between rolling and blue-green deployment?
Show answer
Rolling replaces servers gradually; blue-green switches all traffic from one full environment to another.
In the cache run, roughly what hit ratio did 1000 entries (10% of keys) achieve?
Show answer
Around two thirds of requests, because popularity is skewed.
What is replication lag and one symptom of it?
Show answer
The delay before a replica applies changes; a user may not see their own recent write.
Why does hash modulo N move most keys when N changes?
Show answer
Nearly every key's remainder changes; consistent hashing moves only about 1/(N+1).
Why must queued jobs be idempotent?
Show answer
Queues usually deliver at least once, so a job may run more than once.
Name the three main kinds of telemetry.
Show answer
Logs, metrics and traces.
How many minutes of downtime per 30 days does a 99.9% availability SLO allow?
Show answer
About 43.2 minutes.
Lesson quiz · 5 questions
Score 60% or more to complete this lesson.
Create a free account to save your progress, take quizzes and earn a certificate.