
CMPUT-401 · Lesson 7 of 12 · 32 min
Planning, forecasting and release management
Clients ask two questions more than any others: when will it be done, and what will we get by a given date? Lesson 4 decided what matters most. This lesson covers how a product team answers the when and what questions honestly, and how it gets finished work safely into users' hands. CMPUT-301 covered estimation with story points, velocity-based Monte Carlo forecasting and continuous delivery pipelines; here we take a flow-based view of forecasting that needs no estimates, then turn to release management: planning releases, decoupling deployment from release with feature flags, and rolling changes out in stages so problems reach few users.
Flow metrics
Kanban, as practiced in software following David J. Anderson's work, focuses on the flow of work through a system rather than on time-boxed sprints. Four flow metrics matter most. Work in progress (WIP) is how many items have started but not finished. Throughput is how many items finish per unit of time. Cycle time is how long one item takes from start to finish. Work item age is how long an unfinished item has been in progress. Little's law, from queueing theory, links the first three on average for a stable system: average cycle time equals average WIP divided by average throughput. A team with 10 items in progress finishing 2 per day has an average cycle time of about 5 days. Cutting WIP to 6 would, other things equal, cut cycle time to about 3 days.
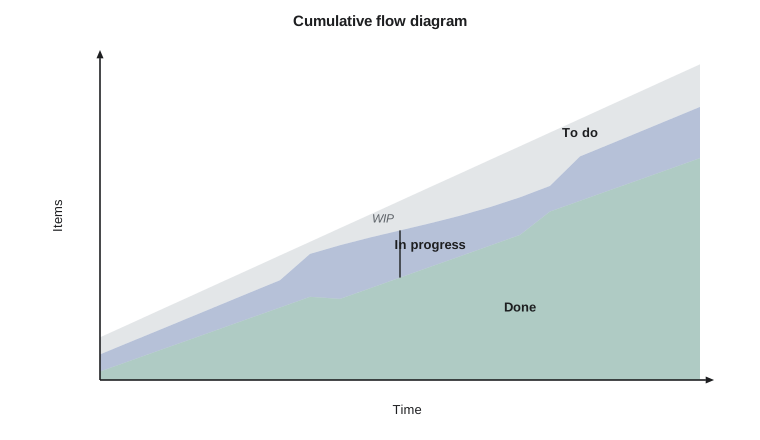
This is why Kanban teams set WIP limits on each column of their board. Limiting WIP feels slower but makes work flow faster: fewer items compete for attention, context switching drops, blocked items become visible and the team swarms to unblock them. For a product team, shorter cycle times also mean faster feedback from users, which matters more than raw output. The cumulative flow diagram, which stacks counts of items in each state over time, shows WIP growing as a widening band and is a useful health check.
Forecasting with throughput
CMPUT-301 forecast completion by simulating sprint velocities in story points. A flow-based alternative, popularized by Daniel Vacanti and Troy Magennis, uses historical throughput directly: count how many items the team actually finished each day, then simulate the future by repeatedly sampling those daily counts. No estimation meeting is required, items need only be split to a reasonably similar size, and the forecast includes all the real-world disruptions, such as sick days and urgent bugs, that were present in the history. The answer is a probability distribution, not a single date.
# "When will it be done?" Monte Carlo forecast from historical daily throughput.
# Unlike a velocity forecast, this samples finished items per DAY from a Kanban board
# and needs no estimates at all. History is invented: items finished on each of 30 workdays.
import random
random.seed(401)
history = [0, 2, 1, 0, 3, 1, 1, 0, 2, 0, 1, 4, 0, 1, 2,
           1, 0, 0, 2, 3, 1, 0, 1, 1, 2, 0, 1, 2, 0, 1]
remaining = 30          # items left before the summer release
runs = 10000
days_needed = []
for _ in range(runs):
    done, days = 0, 0
    while done < remaining:
        done += random.choice(history)
        days += 1
    days_needed.append(days)
days_needed.sort()
for pct in (50, 70, 85, 95):
    d = days_needed[int(runs * pct / 100) - 1]
    print(f"{pct}% chance of finishing within {d} workdays")
print(f"mean throughput {sum(history) / len(history):.2f} items/day")50% chance of finishing within 28 workdays 70% chance of finishing within 30 workdays 85% chance of finishing within 33 workdays 95% chance of finishing within 36 workdays mean throughput 1.10 items/day
The output should be read as a set of commitments at different confidence levels. A 50 percent date is a coin flip and should never be presented to a client as the date. Many teams quote the 85th percentile for external commitments and track progress against it, re-running the forecast every week as new throughput data arrive. Note also that the mean throughput gives a naive estimate of about 30 / 1.10, roughly 27 days, which is close to the median but hides the spread.
The same history answers the fixed-date question. Driftwood's summer timetable starts on a fixed date, so the client wants to know how much of the backlog will be ready. The simulation below samples twenty workdays many times and reports how many items the team will finish at least, with given confidence. The PM can then draw a line in the ordered backlog: items above the 85 percent line are likely, items between the 85 and 50 percent lines are possible, and items below are unlikely.
# The other forecasting question: with a fixed date, how many items will be done?
import random
random.seed(401)
history = [0, 2, 1, 0, 3, 1, 1, 0, 2, 0, 1, 4, 0, 1, 2,
           1, 0, 0, 2, 3, 1, 0, 1, 1, 2, 0, 1, 2, 0, 1]
workdays = 20
runs = 10000
totals = sorted(sum(random.choice(history) for _ in range(workdays)) for _ in range(runs))
for pct in (50, 85, 95):
    # "at least this many" with pct confidence: take the low tail
    k = totals[int(runs * (100 - pct) / 100)]
print(f"{pct}% confident of finishing at least {k} items in {workdays} workdays")50% confident of finishing at least 22 items in 20 workdays 85% confident of finishing at least 17 items in 20 workdays 95% confident of finishing at least 15 items in 20 workdays
Throughput forecasts assume the future resembles the past. They break when the team changes, the type of work changes sharply, or new work keeps arriving faster than expected. For Driftwood, scope growth is a real risk: each discovery round adds items. A good practice is to track arrivals as well as departures and to include an allowance for growth, for example by adding the historical rate of new items to the remaining count.
Release planning
A release is a version of the product made available to users. Release planning decides what goes into upcoming releases, when they happen and how they are communicated. Teams usually choose between two models. Date-driven releases ship on a fixed schedule with whatever is ready, like a release train every two weeks or Driftwood's summer timetable launch; scope flexes. Scope-driven releases ship when a defined set of features is done; the date flexes. Product teams generally prefer fixed dates with flexible scope because dates are what users and clients plan around, and forecasting with confidence levels makes the scope trade-off explicit.
Versioning communicates what changed. Semantic versioning (semver) uses MAJOR.MINOR.PATCH: increment MAJOR for incompatible changes, MINOR for new backward-compatible features and PATCH for backward-compatible fixes. It matters most for libraries and APIs whose users are other programs. For a web app used by travelers, users never see version numbers, but the team still needs release notes: a short, user-facing summary of what is new, what changed and what was fixed, written in plain language. Internal release notes for Driftwood staff also list known issues and who to contact.
Deployment is not release
Continuous delivery, covered in CMPUT-301, makes deploying code to production routine. A key product insight is that deploying code and releasing a feature to users are separate decisions. Feature flags (also called feature toggles) are conditionals in the code that turn a feature on or off at runtime, often for specific users or percentages of users, without a new deployment. With flags, unfinished work can be merged and deployed safely while hidden, the PM decides when to release, and a misbehaving feature can be turned off in seconds instead of rolled back with a new deployment.
Percentage rollouts must be stable: a user who sees a feature at 5 percent must keep seeing it at 25 percent, or the experience flickers. The standard technique hashes the flag name and user identifier into a bucket from 0 to 99 and enables the feature if the bucket is below the rollout percentage. Including the flag name in the hash means different flags pick different users, so the same unlucky people are not always first. The code verifies the key property: as the percentage grows, nobody loses the feature.
# Deterministic percentage rollout: hash the user id with the flag name into 0-99.
# The same user always lands in the same bucket, so raising the percentage only adds users.
import hashlib
def bucket(flag, user_id):
    h = hashlib.sha256(f"{flag}:{user_id}".encode()).hexdigest()
    return int(h[:8], 16) % 100
def enabled(flag, user_id, pct, allow=()):
    return user_id in allow or bucket(flag, user_id) < pct
users = [f"u{i:04d}" for i in range(5000)]
staff = {"u0001", "u0002"}
seen = set()
for stage, pct in [("internal", 0), ("canary", 5), ("early", 25), ("half", 50), ("all", 100)]:
    on = {u for u in users if enabled("capacity_alerts", u, pct, allow=staff)}
    assert seen <= on, "a user lost the feature when the rollout grew"
    seen = on
print(f"{stage:8s} {pct:3d}% -> {len(on):4d} users")internal 0% -> 2 users canary 5% -> 284 users early 25% -> 1223 users half 50% -> 2458 users all 100% -> 5000 users
Flags have costs. Every flag doubles the number of code paths to test, and old flags accumulate as technical debt (lesson 9). Teams should give every release flag an owner and an expiry date, remove it soon after full rollout, and keep the total number of active flags visible. Flag configuration is also a production change: a mistaken flag flip can cause an outage as easily as a bad deployment, so changes should be logged and reviewable.
Staged rollouts
A staged rollout (progressive delivery) releases a change to increasing fractions of users while watching health metrics: internal staff first, then a small canary group such as 1 or 5 percent, then larger steps, with a pause at each stage. Mobile app stores support staged rollouts natively; web teams use flags or traffic routing. Blue-green deployments switch all traffic from an old environment to a new one at once but keep the old one ready for instant switch-back; canary releases route a small share of traffic to the new version first. The point of each is the same: limit the blast radius of a mistake.
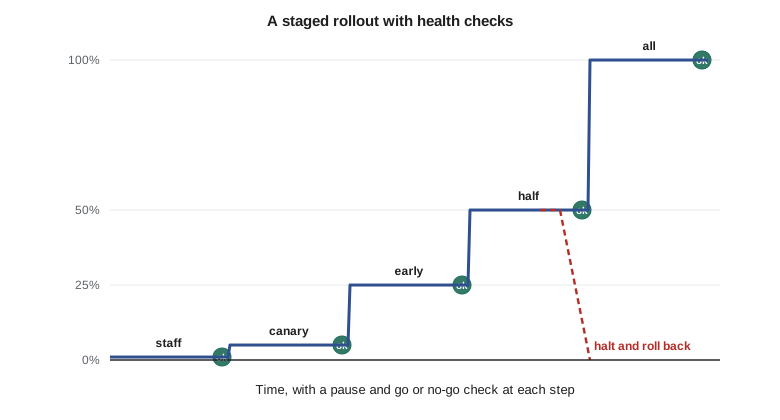
Each stage needs explicit go or no-go criteria decided in advance: error rates, latency, crash rates, support contacts, and the product metric the feature should move. Automated guards compare the flag-on group with the flag-off group and halt the rollout if the new code is clearly worse. The code below shows the logic on invented counts. At 50 percent the error rate of the new path jumps, perhaps because a database query that was fine for 250 users is slow for 2,500, and the guard halts the rollout before everyone is affected.
# Automated rollout guard: compare error rates of the flag-on and flag-off groups.
# Halt the rollout if the new code is clearly worse (invented counts per stage).
from statistics import NormalDist
stages = [
    ("canary 5%",  250, 1, 4750, 19),
    ("early 25%", 1250, 9, 3750, 15),
    ("half 50%",  2500, 41, 2500, 10),
]
for name, n_on, err_on, n_off, err_off in stages:
    p_on, p_off = err_on / n_on, err_off / n_off
    p = (err_on + err_off) / (n_on + n_off)
    se = (p * (1 - p) * (1 / n_on + 1 / n_off)) ** 0.5
    z = (p_on - p_off) / se
    one_sided = 1 - NormalDist().cdf(z)
    decision = "HALT and roll back" if one_sided < 0.01 else "continue"
    print(f"{name:10s} on={p_on:.2%} off={p_off:.2%} p={one_sided:.3f} -> {decision}")
    if decision.startswith("HALT"):
breakcanary 5% on=0.40% off=0.40% p=0.500 -> continue early 25% on=0.72% off=0.40% p=0.078 -> continue half 50% on=1.64% off=0.40% p=0.000 -> HALT and roll back
Release readiness and communication
Before each release, the team confirms that the work meets the definition of done, that the release is ready from a quality standpoint (lesson 8) and that the people affected know what is coming. For Driftwood, communication goes to three audiences: travelers (a banner and social post about new features), staff (a short briefing on what changes for them, especially deckhands entering counts) and the client owner (release notes and the known-issues list). A release is not finished when the code is live; it is finished when users can use it and the team has checked that it is working.
Worked examples
Worked problem
Applying Little's law
Team Lumen has 9 items in progress and finishes 1.5 items per workday. What is the average cycle time, and what happens if WIP is limited to 6?
Show solution
- Cycle time = WIP / throughput = 9 / 1.5 = 6 workdays.
- With WIP 6 and the same throughput: 6 / 1.5 = 4 workdays.
- In practice, lower WIP often raises throughput too, by reducing context switching.
Answer: About 6 workdays now, about 4 with a WIP limit of 6.
Worked problem
Quoting a forecast
The throughput simulation gives 50 percent at 28 workdays and 85 percent at 33. The client asks for a date. What should the PM say?
Show solution
- Avoid quoting 28 days; that is a coin flip.
- Offer the 85 percent figure as the planning commitment, and explain the range.
- Commit to re-forecasting weekly and to flagging early if the forecast slips.
Answer: We are 85 percent confident of finishing the 30 items within 33 workdays, and we will update the forecast every week.
Worked problem
Designing a rollout plan
Write go or no-go criteria for rolling out capacity alerts.
Show solution
- Stages: staff only for two days, 5 percent for two days, 25 percent, 50 percent, 100 percent.
- Halt if alert delivery failures exceed 2 percent, page errors rise significantly versus flag-off users, or support contacts about alerts exceed 5 per day.
- Continue if alerts arrive within two minutes for at least 95 percent of subscribers.
Answer: Explicit stages with measurable halt and continue rules, decided before the rollout starts.
Common mistakes
MistakeGive the client the median forecast as the delivery date.
InsteadQuote a high-confidence percentile such as 85 percent and re-forecast regularly.
MistakeStarting more work keeps everyone busy and finishes sooner.
InsteadHigher WIP lengthens cycle time; limit WIP to improve flow.
MistakeDeploying code means releasing the feature.
InsteadUse feature flags to deploy hidden code and release when ready.
MistakePick rollout users randomly on each request.
InsteadUse a stable hash so users keep the same experience as the rollout grows.
MistakeFeature flags can stay in the code indefinitely.
InsteadGive release flags owners and expiry dates; remove them after full rollout.
Summary and key terms
- Flow metrics: WIP, throughput, cycle time and work item age.
- Little's law: average cycle time equals average WIP divided by throughput.
- Throughput Monte Carlo forecasts completion without estimates; quote high percentiles.
- Fixed dates with flexible scope suit most product releases.
- Feature flags separate deployment from release and provide kill switches.
- Staged rollouts with guard metrics limit the blast radius of mistakes.
- Release communication covers users, staff and the client.
- Work in progress
- Items started but not yet finished.
- Throughput
- The number of items finished per unit of time.
- Cycle time
- The elapsed time from starting an item to finishing it.
- Little's law
- Average cycle time equals average WIP divided by average throughput.
- WIP limit
- A cap on the number of items allowed in a workflow state.
- Cumulative flow diagram
- A stacked chart of item counts per state over time.
- Release train
- Releases on a fixed schedule with whatever work is ready.
- Semantic versioning
- MAJOR.MINOR.PATCH version numbers that signal compatibility.
- Feature flag
- A runtime switch that enables or disables a feature without deployment.
- Staged rollout
- Releasing to increasing fractions of users while monitoring health.
Practice problems
Work each problem on paper first, then reveal the answer to check.
Name the four flow metrics.
Show answer
WIP, throughput, cycle time and work item age.
A team has WIP 12 and throughput 3 per day. What is average cycle time?
Show answer
4 days.
How does a throughput forecast differ from CMPUT-301's velocity forecast?
Show answer
It samples items finished per day and needs no estimates.
In the code, what was the 85 percent forecast for 30 items?
Show answer
About 33 workdays..
Why is the 50 percent date a poor commitment?
Show answer
Half the time the work will finish later.
What does a MINOR version increment signal in semver?
Show answer
A new backward-compatible feature.
Give two reasons to separate deployment from release.
Show answer
Hide unfinished work safely, and turn features off instantly without redeploying.
Why include the flag name in the rollout hash?
Show answer
So different flags select different users first.
In the guard example, at what stage was the rollout halted?
Show answer
At 50 percent, when the error rate jumped.
What is a kill switch?
Show answer
A long-lived ops flag that disables a feature under trouble or load.
Lesson quiz · 5 questions
Score 60% or more to complete this lesson.
Create a free account to save your progress, take quizzes and earn a certificate.