
CMPUT-401 · Lesson 3 of 12 · 32 min
Defining problems and opportunities
Lesson 2 collected evidence about Driftwood's travelers. Evidence alone does not tell a team what to build. Between research and backlog sits a step that many teams skip: framing the problem precisely, choosing which problems matter most, and keeping several possible solutions in view before committing to one. This lesson introduces three tools for that step. Jobs to be done frames problems from the user's point of view. The opportunity solution tree connects a business outcome to user problems and candidate solutions. The Kano model classifies features by how they affect satisfaction. Together they protect a team from the most expensive mistake in product work: building the wrong thing well.
Problem statements before solutions
Clients and teams often arrive with a solution in mind. Driftwood's owner opened the first meeting by asking for an app with online reservations. That may be the right answer, but it is a solution, not a problem. A reservation system is expensive, changes how the business operates and can create new unfairness for walk-up travelers. Before accepting it, the team asks what problem reservations would solve, for whom, how often, and whether simpler solutions would solve it too. A useful habit is the five whys: ask why the client wants the solution, then why that matters, until you reach a problem stated in terms of user or business outcomes.
A good problem statement names who has the problem, what they are trying to do, what gets in the way and why it matters, without naming a solution. For example: Weekday commuters driving to the mainland terminal cannot tell before leaving home whether there will be space on their sailing, so they either leave very early or risk missing work. This framing invites many solutions: a live space indicator, alerts, reservations, a reserved commuter lane, or extra sailings. It also tells the team how to measure success: fewer missed sailings and less early arrival among commuters.
Jobs to be done
Jobs to be done (JTBD) is a way of thinking popularized by Clayton Christensen and others: people do not buy products, they hire them to make progress in a particular situation. The classic example is a milkshake hired by morning commuters to make a long drive less boring and keep them full until lunch, competing not with other milkshakes but with bananas, bagels and boredom. The insight for product teams is that competition and value are defined by the job, not by the product category. Driftwood's real competitor for some island residents is not another ferry; it is staying home, or the float plane.
A job statement has a standard shape: When [situation], I want to [motivation], so I can [expected outcome]. Jobs have functional parts (what needs doing), emotional parts (how the person wants to feel) and social parts (how they want to be seen). The emotional dimension often matters most. A commuter's functional job is getting to work on time; the emotional job is not starting every day anxious. A solution that technically provides information but still leaves people anxious, for example a space indicator that updates only hourly, fails the emotional job.
JTBD has variants: Christensen's milkshake style focuses on the circumstances of a purchase, while Tony Ulwick's Outcome-Driven Innovation breaks a job into steps and measures desired outcomes such as minimize the time it takes to know whether there will be space. You do not need to adopt a whole methodology. The practical lesson is to describe needs in terms of progress in a situation, which keeps the team focused on outcomes rather than features and reveals competitors and workarounds that a feature list would miss.
Opportunity solution trees
Teresa Torres's opportunity solution tree (OST) is a visual map with four levels. At the top is a desired outcome, a measurable business or product result the team has been asked to drive, such as reduce missed sailings due to full decks by 30 percent this summer. Below it are opportunities: user needs, pain points and desires discovered through research, phrased from the user's perspective. Below each opportunity are candidate solutions. At the bottom are assumption tests: small experiments to check whether a solution will work, which lesson 5 covers in detail.
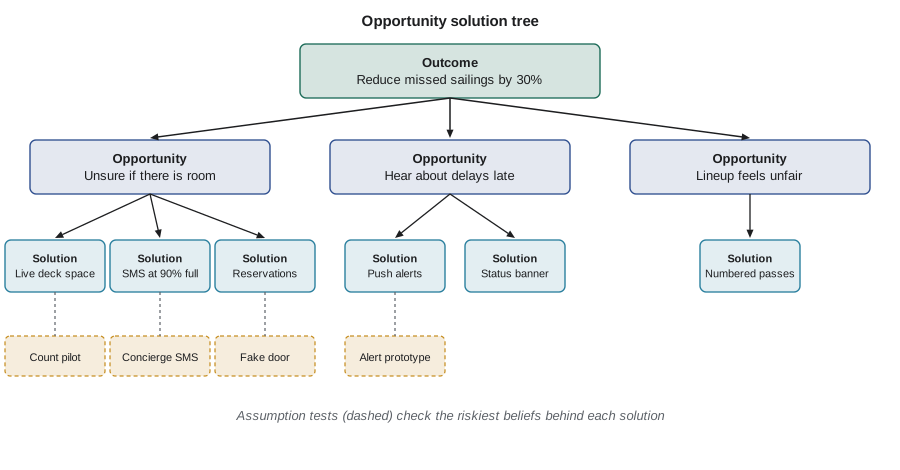
The tree's value comes from its structure. Opportunities are separated from solutions, so the team does not jump from the outcome straight to a favorite feature. Each opportunity can have several solutions, which encourages comparing options rather than validating one idea. Large opportunities can be broken into smaller child opportunities until one is specific enough to act on. And because everything hangs from one outcome, the tree makes it obvious when a proposed feature does not connect to the goal at all. The code below represents a small Driftwood tree as data and orders the opportunities by a rough score of reach times pain; real teams use judgment, but a simple score helps start the conversation.
# An opportunity solution tree as nested data, with simple scoring of opportunities.
tree = {
    "outcome": "Reduce missed sailings due to full decks by 30% this summer",
    "opportunities": [
        {"name": "I don't know if there will be room before I leave home",
         "reach": 0.60, "pain": 4,
         "solutions": ["live deck-space indicator", "SMS alert when 90% full", "reservations"]},
        {"name": "I hear about delays too late to change plans",
         "reach": 0.45, "pain": 3,
         "solutions": ["push alerts on delay", "status banner on home screen"]},
        {"name": "The lineup feels unfair and confusing",
         "reach": 0.25, "pain": 3,
         "solutions": ["numbered boarding passes", "clearer lane signs"]},
        {"name": "Tourists don't know the island-side rules",
         "reach": 0.20, "pain": 2,
         "solutions": ["first-visit guide page"]},
    ],
}
print("Outcome:", tree["outcome"])
ranked = sorted(tree["opportunities"], key=lambda o: o["reach"] * o["pain"], reverse=True)
for o in ranked:
    print(f"  [{o['reach'] * o['pain']:.2f}] {o['name']}")
    for s in o["solutions"]:
print(" -", s)Outcome: Reduce missed sailings due to full decks by 30% this summer
[2.40] I don't know if there will be room before I leave home
- live deck-space indicator
- SMS alert when 90% full
- reservations
[1.35] I hear about delays too late to change plans
- push alerts on delay
- status banner on home screen
[0.75] The lineup feels unfair and confusing
- numbered boarding passes
- clearer lane signs
[0.40] Tourists don't know the island-side rules
- first-visit guide pageTwo cautions apply. First, outcomes must be something the team can influence. Increase Driftwood's annual revenue is a business outcome shaped by fuel prices, weather and tourism; reduce missed sailings due to full decks is a product outcome the team can move. Second, the tree is a living document. As research and experiments produce evidence, opportunities are added, merged or dropped, and solutions are pruned. A tree that never changes is a sign that discovery has stopped.
The Kano model
Not all features affect satisfaction in the same way. Noriaki Kano's model, developed in the 1980s, sorts features into categories. Must-be (basic) features are expected; their absence causes strong dissatisfaction, but their presence earns no credit, like an accurate schedule. Performance (one-dimensional) features increase satisfaction roughly in proportion to how well they are delivered, like how fresh the live wait time is. Attractive (delighter) features are unexpected; their absence goes unnoticed but their presence delights, like a notification that a spot opened on an earlier sailing. Indifferent features make little difference either way, and reverse features annoy some users when present.
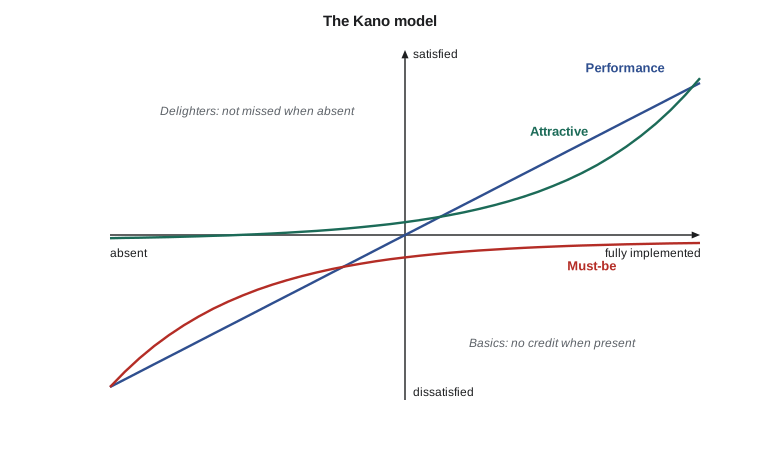
Kano categories are measured with a paired questionnaire. For each feature, respondents answer a functional question (how would you feel if the app had this?) and a dysfunctional question (how would you feel if it did not?), each on a five-point scale from I like it to I dislike it. A lookup table converts each pair into a category, and the most common category wins. Two summary coefficients are often reported: the better coefficient (how much satisfaction rises if the feature is present) and the worse coefficient (how much dissatisfaction rises if it is absent). The code below classifies four candidate Driftwood features from invented survey responses.
# Kano classification from paired survey questions (invented responses).
# Each respondent answers a functional question ("How would you feel if the app HAD this?")
# and a dysfunctional one ("...if it did NOT have this?") on a 5-point scale:
# L=like, M=must-be (expect it), N=neutral, T=can tolerate, D=dislike.
from collections import Counter
TABLE = {  # rows: functional answer, columns: dysfunctional answer
    "L": {"L": "Q", "M": "A", "N": "A", "T": "A", "D": "O"},
    "M": {"L": "R", "M": "I", "N": "I", "T": "I", "D": "M"},
    "N": {"L": "R", "M": "I", "N": "I", "T": "I", "D": "M"},
    "T": {"L": "R", "M": "I", "N": "I", "T": "I", "D": "M"},
    "D": {"L": "R", "M": "R", "N": "R", "T": "R", "D": "Q"},
}
NAMES = {"M": "must-be", "O": "performance", "A": "attractive", "I": "indifferent",
         "R": "reverse", "Q": "questionable"}
survey = {
    "accurate sailing schedule": ["MD"] * 9 + ["ND"] * 5 + ["LD"] * 3 + ["NN"] * 1,
    "live vehicle-deck space":   ["LD"] * 8 + ["LN"] * 4 + ["MD"] * 4 + ["NN"] * 2,
    "reserve a spot":            ["LN"] * 7 + ["LD"] * 5 + ["NN"] * 4 + ["LT"] * 2,
    "ferry-themed avatars":      ["NN"] * 10 + ["LN"] * 4 + ["NT"] * 2 + ["DN"] * 2,
}
for feature, answers in survey.items():
    cats = Counter(TABLE[a[0]][a[1]] for a in answers)
    top, n = cats.most_common(1)[0]
    better = (cats["A"] + cats["O"]) / (cats["A"] + cats["O"] + cats["M"] + cats["I"])
    worse = (cats["O"] + cats["M"]) / (cats["A"] + cats["O"] + cats["M"] + cats["I"])
    print(f"{feature:27s} {NAMES[top]:12s} ({n}/{len(answers)})  "
f"better={better:.2f} worse={worse:.2f}")accurate sailing schedule must-be (14/18) better=0.17 worse=0.94 live vehicle-deck space performance (8/18) better=0.67 worse=0.67 reserve a spot attractive (9/18) better=0.78 worse=0.28 ferry-themed avatars indifferent (12/18) better=0.25 worse=0.00
The results guide priorities in a specific way. Must-be features come first, because missing them causes complaints no matter how clever the rest is: an inaccurate schedule would sink the app. Performance features are where the team competes and should invest in proportion to value. Attractive features are cheap differentiation when affordable. Indifferent features, such as ferry-themed avatars here, can usually be dropped. Categories also drift over time: yesterday's delighter becomes today's expectation, which is why live tracking now feels basic in transit apps.
Framing assumptions
Every solution rests on assumptions. A live space indicator assumes Driftwood can count cars in real time, that commuters will check the app before leaving, that they trust the number and that it changes their behavior. Torres groups assumptions into desirability (do people want it?), viability (does it work for the business?), feasibility (can we build it?), usability (can people use it?) and ethical (could it cause harm?). Writing assumptions down, then ranking them by how important and how uncertain they are, tells the team what to test first. The riskiest assumption for the space indicator turned out to be feasibility: deckhands currently count cars on a clipboard.
Worked examples
Worked problem
From solution request to problem
The owner says: We need reservations. Use the five whys to reach a problem statement.
Show solution
- Why reservations? Because people are angry when they miss a sailing.
- Why do they miss sailings? Because decks fill on busy days and they arrive too late.
- Why do they arrive too late? Because they cannot tell in advance whether it will be busy.
- Problem statement: Travelers cannot tell before leaving home whether their sailing will have space, so they miss sailings or arrive very early.
Answer: The problem is uncertainty about space; reservations are one of several possible solutions, alongside live indicators and alerts.
Worked problem
Writing a job statement
Write a job statement for an island resident who drives to the mainland for medical appointments.
Show solution
- Situation: When I have a fixed-time appointment on the mainland,
- Motivation: I want to be sure I can board a sailing that gets me there on time,
- Outcome: so I do not miss the appointment or spend hours waiting.
- Emotional dimension: not worrying the night before.
Answer: When I have a fixed-time mainland appointment, I want to be sure of a sailing that gets me there on time, so I do not miss it or waste hours waiting.
Worked problem
Interpreting a Kano result
In the output, reserve a spot is attractive with better near 0.78 and worse near 0.28. What does that mean for planning?
Show solution
- Attractive means its absence will not cause much dissatisfaction today.
- A high better coefficient means offering it would raise satisfaction noticeably.
- It is therefore a candidate for later, after must-be features such as the accurate schedule are solid.
Answer: Treat reservations as a future differentiator, not a launch requirement; secure must-be and performance features first.
Common mistakes
MistakeAccept the client's requested feature as the requirement.
InsteadUse five whys to uncover the underlying problem, then consider several solutions.
MistakeA problem statement can include the solution.
InsteadDescribe who, what they are trying to do, the obstacle and why it matters, without naming a solution.
MistakeJobs are about functional tasks only.
InsteadJobs include emotional and social dimensions that often decide whether a solution succeeds.
MistakeAn opportunity solution tree has one solution per opportunity.
InsteadGenerate several solutions per opportunity and compare them.
MistakeEvery feature should delight.
InsteadMust-be features must be solid first; delighters on top of a broken basic feature do not help.
Summary and key terms
- Turn solution requests into problem statements with five whys.
- Jobs to be done describes progress a person wants in a situation, with functional, emotional and social parts.
- An opportunity solution tree links a measurable outcome to opportunities, solutions and assumption tests.
- Outcomes should be ones the team can influence.
- Kano sorts features into must-be, performance, attractive, indifferent and reverse.
- Write down assumptions and test the most important, most uncertain ones first.
- Problem statement
- A description of who has a problem, what they are trying to do, the obstacle and why it matters.
- Five whys
- Repeatedly asking why to move from a symptom or solution to an underlying cause.
- Jobs to be done
- A framework that treats products as hired to make progress in a situation.
- Job statement
- When [situation], I want to [motivation], so I can [outcome].
- Opportunity solution tree
- A visual map from a desired outcome to opportunities, solutions and assumption tests.
- Opportunity
- A user need, pain point or desire discovered through research.
- Kano model
- A classification of features by their effect on satisfaction.
- Must-be feature
- An expected feature whose absence causes dissatisfaction but whose presence earns little credit.
- Attractive feature
- An unexpected feature that delights when present and is not missed when absent.
- Assumption
- A belief that must be true for a solution to succeed.
Practice problems
Work each problem on paper first, then reveal the answer to check.
Rewrite "build a reservation system" as a problem statement.
Show answer
For example: Travelers cannot tell before leaving whether there will be space, so they miss sailings or arrive very early.
What three dimensions does a job have?
Show answer
Functional, emotional and social.
Name a non-ferry competitor for an island resident's trip to the mainland.
Show answer
Staying home, a float plane, or online services instead of traveling.
What are the four levels of an opportunity solution tree?
Show answer
Outcome, opportunities, solutions, assumption tests.
Why is "increase annual revenue" a weak OST outcome for a product team?
Show answer
It depends on many factors outside the team's control.
In the OST code, which opportunity ranked first?
Show answer
Not knowing if there will be room before leaving home.
Give an example of a must-be feature for the ferry app.
Show answer
An accurate sailing schedule.
How is a Kano category determined for one respondent?
Show answer
By combining the functional and dysfunctional answers in the evaluation table.
Which Kano category was ferry-themed avatars, and what should the team do?
Show answer
Indifferent; it can usually be dropped.
What was the riskiest assumption for the live space indicator?
Show answer
Feasibility: whether cars can be counted in real time when deckhands use a clipboard.
Lesson quiz · 5 questions
Score 60% or more to complete this lesson.
Create a free account to save your progress, take quizzes and earn a certificate.