
CMPUT-401 · Lesson 5 of 12 · 31 min
Experiments, MVPs and validated learning
Discovery produces hypotheses: commuters will check a space indicator before leaving home; an alert prompt after the first schedule view will raise sign-ups; tourists will read a first-visit guide. Each is an assumption, and every untested assumption is a bet with the client's money. This lesson covers how product teams test assumptions cheaply before and after building: minimum viable products, prototypes and fake doors before writing much code, and controlled experiments such as A/B tests once a product has users. The goal, in Eric Ries's phrase from The Lean Startup, is validated learning: evidence that a hypothesis is true or false, gathered as cheaply and quickly as possible.
Build, measure, learn
The lean startup loop is build, measure, learn: build the smallest thing that tests a hypothesis, measure what happens, and learn whether to persevere, change direction (pivot) or stop. The loop is usually planned backwards. First decide what you need to learn, then what you need to measure to learn it, and only then what you need to build to measure it. Many experiments need no software at all. A clear hypothesis has a specific form: We believe that [change] for [users] will result in [outcome]; we will know we are right when [measurable signal] within [time].
For the live space indicator, Team Lumen wrote: We believe that showing remaining vehicle space for the next two sailings will cause weekday commuters to check before leaving home; we will know we are right when at least 40 percent of surveyed commuters report checking it at least three times in a two-week pilot, and early arrivals in the lineup fall. The threshold is set before the experiment, not after. Deciding success criteria in advance is what separates an experiment from a demonstration.
Minimum viable products
A minimum viable product (MVP) is the smallest thing that lets you learn whether an idea is worth pursuing. The term is widely misused to mean a buggy first release. Ries's meaning is narrower: an MVP is a learning tool, and it may not be a product at all. The useful question is not what is the smallest product we can ship, but what is the cheapest way to test our riskiest assumption.
Some MVP types raise ethical questions. A fake door that misleads people can damage trust, so it should explain honestly on click that the feature is being considered and let people register interest; it should never take payment for something that does not exist. A Wizard of Oz test should avoid processing personal information in ways users did not expect. And the concierge approach, though unscalable, is often the fastest way to learn what users really want, because the team interacts with each one personally.
Prototyping and usability testing
Before building an interface, test it. Usability testing asks representative users to complete realistic tasks with a prototype while thinking aloud, and the team watches where they hesitate, misunderstand or fail. Five users per round find most major usability problems, per Jakob Nielsen's widely cited rule of thumb; several small rounds with fixes in between beat one large round. For Driftwood, Team Lumen tested three tasks: find the next sailing to the north island; check whether today's 5:40 sailing is delayed; find out whether the island terminal accepts cash. The third task failed for four of five users, because the answer was buried in a frequently asked questions page.
A/B tests
Once a product has enough users, the strongest evidence comes from a controlled experiment, usually called an A/B test. Users are randomly assigned to a control (A) or a variant (B), the team measures a primary metric such as the delay-alert sign-up rate, and statistics determine whether any difference is larger than chance would produce. Randomization is the key: it balances everything else, such as time of day, device and type of traveler, between groups, so a difference in the metric can be attributed to the change.
A test needs a sample size decided in advance. It depends on the baseline rate, the minimum detectable effect (MDE), meaning the smallest lift worth detecting, the significance level alpha (the false positive rate, usually 5 percent), and power (the chance of detecting a real effect of size MDE, usually 80 percent). Small effects need large samples, roughly in proportion to one over the square of the effect. The code computes visitors per arm for a 20 percent baseline.
# Sample size per arm for a two-proportion A/B test (normal approximation).
from statistics import NormalDist
def n_per_arm(p1, mde, alpha=0.05, power=0.80):
    p2 = p1 + mde
    z_a = NormalDist().inv_cdf(1 - alpha / 2)
    z_b = NormalDist().inv_cdf(power)
    pbar = (p1 + p2) / 2
    num = (z_a * (2 * pbar * (1 - pbar)) ** 0.5
           + z_b * (p1 * (1 - p1) + p2 * (1 - p2)) ** 0.5) ** 2
    return int(num / mde ** 2) + 1
base = 0.20   # 20% of visitors currently sign up for delay alerts (illustrative)
for mde in (0.01, 0.02, 0.04, 0.08):
print(f"detect +{mde:.0%} absolute lift: {n_per_arm(base, mde):6d} visitors per arm")detect +1% absolute lift: 25583 visitors per arm detect +2% absolute lift: 6510 visitors per arm detect +4% absolute lift: 1683 visitors per arm detect +8% absolute lift: 447 visitors per arm
Driftwood's site gets perhaps 4,000 visitors a week in summer and far fewer in winter. Detecting a 1 percentage-point lift would take months; detecting 4 points takes under a week. Low-traffic products, which include most client projects, can only detect large effects with A/B tests and should rely more on qualitative methods. This is an important reality check: A/B testing is powerful for large consumer products, but often impractical for small clients.
When the test finishes, analyze it once with the planned test. The code below runs a two-proportion z-test on invented results: the variant shows the sign-up prompt after a traveler first views the schedule.
# Evaluate a finished test with a two-proportion z-test and a confidence interval.
from statistics import NormalDist
a_users, a_conv = 2100, 420    # control: plain sign-up link
b_users, b_conv = 2080, 491    # variant: sign-up prompt after first schedule view
pa, pb = a_conv / a_users, b_conv / b_users
p = (a_conv + b_conv) / (a_users + b_users)
se_pool = (p * (1 - p) * (1 / a_users + 1 / b_users)) ** 0.5
z = (pb - pa) / se_pool
p_value = 2 * (1 - NormalDist().cdf(abs(z)))
se = (pa * (1 - pa) / a_users + pb * (1 - pb) / b_users) ** 0.5
lo, hi = (pb - pa) - 1.96 * se, (pb - pa) + 1.96 * se
print(f"control {pa:.1%}  variant {pb:.1%}  lift {pb - pa:+.1%}")
print(f"z = {z:.2f}, p = {p_value:.4f}")
print(f"95% CI for lift: {lo:+.1%} to {hi:+.1%}")control 20.0% variant 23.6% lift +3.6% z = 2.82, p = 0.0048 95% CI for lift: +1.1% to +6.1%
The p-value is the probability of seeing a difference at least this large if there were truly no difference. It is not the probability that the variant is better, and a p-value below 0.05 does not guarantee the effect is large or important. The confidence interval is more informative: it gives a range of plausible lifts. Here the whole interval is above zero, so the prompt very likely helps, and the plausible size of the effect is roughly 1 to 6 points. For a fuller treatment of hypothesis testing see a statistics course such as STAT-151; here we focus on how to run experiments well as a product team.
The peeking problem
The most common A/B testing mistake is peeking: checking results repeatedly while the test runs and stopping as soon as the result is significant. Each look is another chance for random noise to cross the threshold, so the real false positive rate rises far above 5 percent. The simulation runs A/A tests, where both groups get the same experience so any significant result is a false positive, and stops at the first look with p below 0.05.
# Why peeking inflates false positives: an A/A test (no real difference),
# checked after every batch of visitors and stopped at the first p < 0.05.
import random
from statistics import NormalDist
random.seed(401)
def p_value(ca, na, cb, nb):
    p = (ca + cb) / (na + nb)
    se = (p * (1 - p) * (1 / na + 1 / nb)) ** 0.5
    if se == 0:
        return 1.0
    z = ((cb / nb) - (ca / na)) / se
    return 2 * (1 - NormalDist().cdf(abs(z)))
def run(peeks, batch=200, rate=0.20):
    ca = cb = na = nb = 0
    for k in range(peeks):
        ca += sum(random.random() < rate for _ in range(batch)); na += batch
        cb += sum(random.random() < rate for _ in range(batch)); nb += batch
        if peeks > 1 and p_value(ca, na, cb, nb) < 0.05:
            return True
    return p_value(ca, na, cb, nb) < 0.05
trials = 1000
for peeks in (1, 5, 10, 20):
    fp = sum(run(peeks) for _ in range(trials))
print(f"{peeks:2d} looks: false positive rate {fp / trials:.1%}")1 looks: false positive rate 5.4% 5 looks: false positive rate 14.1% 10 looks: false positive rate 20.6% 20 looks: false positive rate 26.6%
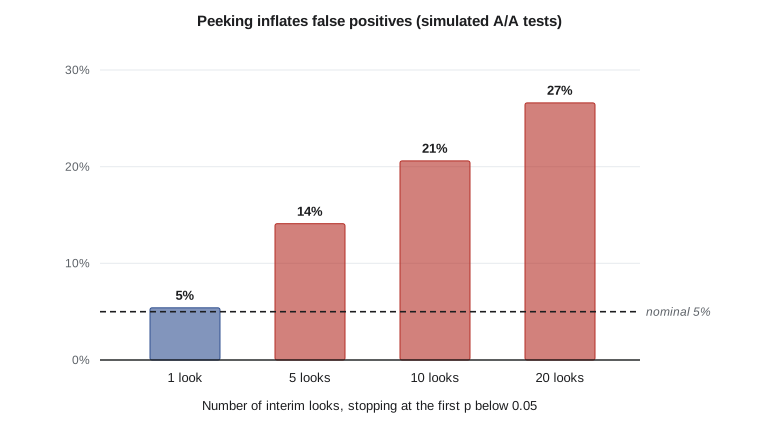
Remedies exist. The simplest is discipline: fix the sample size or duration in advance and analyze once. Sequential testing methods, used by many commercial experimentation platforms, adjust the threshold so that repeated looks keep the overall error rate at 5 percent. Bayesian approaches report the probability of improvement but have their own stopping pitfalls. Whatever method is used, the team should pre-register the primary metric, the sample size and the decision rule.
Other experiment pitfalls
Several other mistakes are common. Testing many metrics and reporting whichever moved (multiple comparisons) produces false discoveries; pick one primary metric and a few guardrail metrics, such as page load time and unsubscribe rate, that must not get worse. Novelty effects make new designs look better at first simply because they are new; run tests for at least a full weekly cycle. Sample ratio mismatch, where the split is noticeably different from 50/50, signals a bug in assignment and invalidates the result. And tests on a few days of summer traffic may not generalize to winter commuters.
Pivot or persevere
Experiments feed decisions. If evidence supports the hypothesis, persevere and invest. If it contradicts the hypothesis, consider a pivot: a structured change in strategy, such as targeting a different segment (truck drivers rather than tourists), solving a different problem (delay information rather than space), or changing the solution (alerts rather than a live indicator). Driftwood's Wizard of Oz pilot found that commuters checked the indicator but found the deckhand's manual updates too infrequent to trust; the team persevered with the goal but pivoted the solution to an SMS alert when the deck reached 90 percent full, which was feasible with manual counts.
Worked examples
Worked problem
Planning a test
Baseline sign-up is 20 percent. The team only cares about a lift of 4 points or more. Driftwood has about 4,000 visitors a week. How long should the test run?
Show solution
- From the code, detecting +4 points needs about 1,700 visitors per arm, so about 3,400 in total.
- At 4,000 a week this takes under a week, but run a full week to cover weekday and weekend patterns.
- Fix the duration, the primary metric and the decision rule before starting.
Answer: Run one full week, then analyze once.
Worked problem
Reading a result
A test reports p = 0.03 with a 95 percent interval for lift of +0.2 to +4.0 points. The variant costs a lot to maintain. What should the team conclude?
Show solution
- The effect is probably real, since the interval excludes zero.
- The effect could be as small as 0.2 points, which may not justify the maintenance cost.
- Weigh the plausible range of benefit against cost, or run a longer test to narrow the interval.
Answer: Statistical significance is not practical importance; decide using the interval and the costs.
Worked problem
Choosing an MVP
The client wants to know whether commuters would buy a monthly priority pass. What is the cheapest test?
Show solution
- A fake door or landing page describing the pass with an interest form measures demand.
- Honest messaging: explain that the pass is being considered and no payment is taken.
- Set a threshold in advance, for example 15 percent of commuters who see it register interest.
Answer: A transparent fake door or landing page tests demand before any build.
Common mistakes
MistakeAn MVP is a rough first version of the full product.
InsteadAn MVP is the cheapest way to learn whether a key assumption holds; it may not be software.
MistakeSet success criteria after looking at the results.
InsteadDefine the metric, threshold and decision rule before the experiment.
MistakeCheck the A/B dashboard daily and stop when significant.
InsteadFix the sample size and analyze once, or use a proper sequential method.
Mistakep < 0.05 means the variant is definitely better and the effect is big.
InsteadIt means the data would be unusual if there were no effect; read the confidence interval for size.
MistakeEvery product should A/B test every change.
InsteadLow-traffic products can only detect large effects; use qualitative methods and prototypes instead.
Summary and key terms
- Validated learning tests assumptions with evidence, as cheaply as possible.
- Plan build-measure-learn backwards from what you need to learn.
- Write hypotheses with measurable success criteria set in advance.
- MVPs include prototypes, concierge, Wizard of Oz, fake doors and landing pages; keep them honest.
- A/B tests need a planned sample size based on baseline, MDE, alpha and power.
- Peeking inflates false positives; analyze once or use sequential methods.
- Use evidence to persevere, pivot or stop.
- Validated learning
- Evidence-based learning about whether a product hypothesis is true.
- Hypothesis
- A testable belief about a change, the users affected and the expected measurable outcome.
- Minimum viable product
- The cheapest experiment or product that tests a key assumption.
- Wizard of Oz test
- An experiment where humans secretly perform what appears automated.
- Fake door
- An entry point for a not-yet-built feature used to measure demand.
- A/B test
- A randomized controlled experiment comparing a control and a variant.
- Minimum detectable effect
- The smallest effect a test is designed to detect reliably.
- Statistical power
- The probability of detecting a real effect of a given size.
- Peeking
- Repeatedly checking results and stopping at significance, inflating false positives.
- Pivot
- A structured change of strategy based on evidence.
Practice problems
Work each problem on paper first, then reveal the answer to check.
In what order should build-measure-learn be planned?
Show answer
Backwards: learn, then measure, then build.
Write a hypothesis for a first-visit guide for tourists.
Show answer
For example: We believe a first-visit guide will reduce tourist phone calls; we will know when tourist calls fall 25 percent in four weeks.
What distinguishes a Wizard of Oz test from a concierge test?
Show answer
In Wizard of Oz, users believe the system is automated; in concierge, the manual service is visible.
How can a fake door test stay ethical?
Show answer
Explain honestly on click, invite interest and never take payment.
How many users per round does Nielsen suggest for usability tests?
Show answer
About five, over several rounds.
Why does a smaller MDE need a larger sample?
Show answer
Required sample grows roughly with one over the square of the effect.
In the z-test example, what is the observed lift and is it significant?
Show answer
About +3.6 points with p below 0.05; the interval excludes zero.
In the peeking simulation, what happened with 20 looks?
Show answer
The false positive rate rose to roughly a quarter, far above 5 percent.
What is a guardrail metric?
Show answer
A metric that must not get worse, such as load time or unsubscribe rate.
What pivot did Team Lumen make after the Wizard of Oz pilot?
Show answer
From a live indicator to SMS alerts at 90 percent full.
Lesson quiz · 5 questions
Score 60% or more to complete this lesson.
Create a free account to save your progress, take quizzes and earn a certificate.