
CIV-380 · Lesson 8 of 12 · 21 min
Wastewater characteristics, preliminary and primary treatment
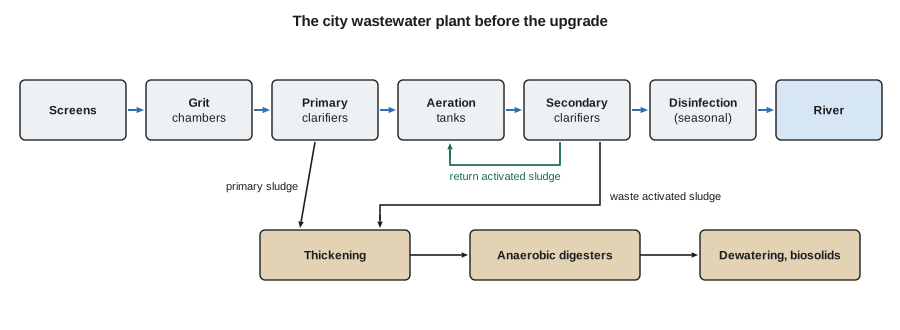
The second half of this course turns to one of the city's wastewater treatment plants, on the Big Sioux downstream of the city. Built in stages from the 1960s, it now provides primary treatment, conventional activated sludge, anaerobic digestion and seasonal disinfection for about 7.9 MGD. Its NPDES permit is being renewed with the phosphorus and ammonia limits of lesson 1, and parts of its headworks are worn out. Martin's first instruction to Nadia is the same as for any wastewater project: before designing anything, establish what is coming in.
Where the flow comes from
Municipal wastewater is a mixture of domestic sewage from homes, commercial and institutional wastewater, industrial discharges, infiltration of groundwater through cracked pipes and leaky joints, and inflow of stormwater through roof leaders, foundation drains and manhole covers connected illegally or by older practice. Infiltration and inflow (I/I) can double the flow in wet weather, diluting the sewage and filling the plant with water that need not be treated.
Domestic water use in North America is typically 200 to 300 L per person per day (55 to 80 gal), and most of it returns to the sewer. Plants are designed on per capita figures of about 350 to 500 L per person per day (90 to 130 gal) once commercial use and normal infiltration are included. The flow varies through the day, from a minimum in the early morning to peaks in the morning and evening, and through the year with groundwater levels and snowmelt.
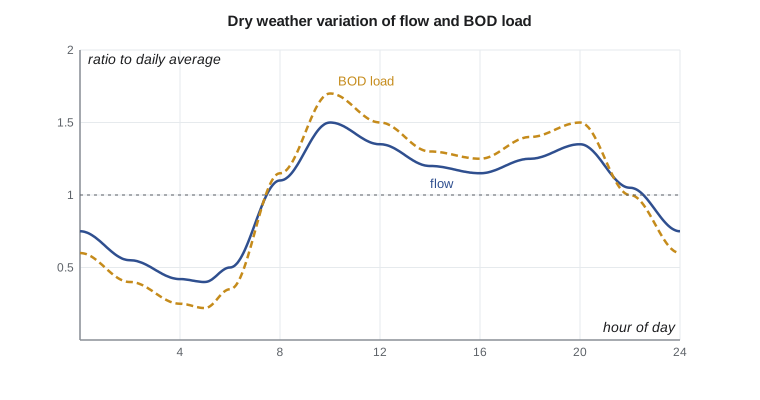
The peak hourly flow for design of sewers and plant hydraulics is often estimated from population with an empirical peaking factor. The Harmon formula, widely used in Canadian and US practice for sanitary flow, is
where \(P\) is the population in thousands. The factor falls from about 3.8 for a small town to 2 for a city of 100,000. Measured flow records should always be preferred where they exist, and wet weather peaks from I/I are added separately.
What is in it
Wastewater quality is described by a small set of lumped and specific parameters. The five-day biochemical oxygen demand (BOD₅) and chemical oxygen demand (COD) measure organic matter, as CIV-280 explained; total suspended solids (TSS) and volatile suspended solids measure particulate matter; total Kjeldahl nitrogen (TKN), the sum of organic nitrogen and ammonia, and total phosphorus (TP) measure the nutrients. For biological process design, COD is divided further into readily biodegradable, slowly biodegradable and unbiodegradable fractions, soluble and particulate, because each behaves differently in the process.
| Parameter | Weak | Medium | Strong |
|---|---|---|---|
| BOD₅, mg/L | 110 | 190 | 350 |
| COD, mg/L | 250 | 430 | 800 |
| TSS, mg/L | 120 | 210 | 400 |
| TKN, mg/L as N | 20 | 40 | 70 |
| Total phosphorus, mg/L as P | 4 | 7 | 12 |
| Fats, oils and grease, mg/L | 50 | 90 | 100 |
Joy's sampling program collects flow-proportional 24-hour composite samples of the raw sewage three days a week for a year. The city plant's influent averages BOD₅ 220, TSS 240, TKN 45 and TP 7 mg/L, a medium to strong sewage. About a third of the BOD load comes from a large food processing plant whose discharge is governed by the city's pretreatment program and sewer use ordinance, which set limits and surcharges for high-strength discharges.
# Wastewater flows, loads and preliminary/primary sizing for the city plant
from math import sqrt
UNITS = "US"
SI = UNITS == "SI"
pop = 58000
Qavg = 30000.0                                 # m3/d average dry weather plus normal infiltration
conc = {"BOD5": 220, "TSS": 240, "TKN": 45, "TP": 7.0}   # mg/L influent
P = pop / 1000
PF = 1 + 14 / (4 + sqrt(P))                   # Harmon peaking factor
Qpeak = PF * Qavg
if SI:
    print(f"per capita flow {Qavg*1000/pop:.0f} L/(person d); Harmon factor {PF:.2f}; peak flow {Qpeak:,.0f} m3/d")
else:
    print(f"per capita flow {Qavg*264.17/pop:.0f} gal/(person d); Harmon factor {PF:.2f}; peak flow {Qpeak/3785.4:.1f} MGD")
for k, c in conc.items():
    kg = c * Qavg / 1000
    print(f"{k:5s} {c:6.1f} mg/L -> {kg:8,.0f} kg/d = {kg*1000/pop:5.1f} g/(person d)" if SI else
          f"{k:5s} {c:6.1f} mg/L -> {kg*2.2046:8,.0f} lb/d = {kg*2.2046/pop:5.3f} lb/(person d)")
# primary clarifiers: overflow rate 40 m3/(m2 d) at average flow, check at peak; circular tanks
sor = 40.0
A = Qavg / sor
n = 3
D = sqrt(4 * A / n / 3.14159)
print(f"primary area {A:,.0f} m2 -> {n} clarifiers of {D:.1f} m diameter; peak overflow {Qpeak/A:.0f} m3/(m2 d)" if SI else
      f"primary area {A*10.764:,.0f} ft2 -> {n} clarifiers of {D*3.281:.0f} ft diameter; peak overflow {Qpeak/A*24.54:,.0f} gpd/ft2")
# typical removal in primary treatment
eff = {"BOD5": 0.32, "TSS": 0.60, "TKN": 0.10, "TP": 0.12}
for k, c in conc.items():
print(f"primary effluent {k:5s} {c*(1-eff[k]):6.1f} mg/L")per capita flow 137 gal/(person d); Harmon factor 2.21; peak flow 17.5 MGD BOD5 220.0 mg/L -> 14,550 lb/d = 0.251 lb/(person d) TSS 240.0 mg/L -> 15,873 lb/d = 0.274 lb/(person d) TKN 45.0 mg/L -> 2,976 lb/d = 0.051 lb/(person d) TP 7.0 mg/L -> 463 lb/d = 0.008 lb/(person d) primary area 8,073 ft2 -> 3 clarifiers of 59 ft diameter; peak overflow 2,165 gpd/ft2 primary effluent BOD5 149.6 mg/L primary effluent TSS 96.0 mg/L primary effluent TKN 40.5 mg/L primary effluent TP 6.2 mg/L
The loads are what the biological process must handle: about 14,600 lb/d of BOD₅, 15,900 lb/d of TSS, 3,000 lb/d of TKN and 460 lb/d of phosphorus. Per person served, they work out to about 0.25 lb/d of BOD₅, well above the 0.13 to 0.18 lb/d typical of domestic sewage alone, which confirms the industrial contribution. Designers often express loads in population equivalents so that industrial and domestic sources can be compared.
Worked problem
A population equivalent
The food processor discharges 4,850 lb/d of BOD₅. If domestic sewage contributes 0.18 lb of BOD₅ per person per day, what population equivalent does the plant represent?
Show solution
- \[PE = \frac{4\,850\ \text{lb/d}}{0.18\ \text{lb/(person·d)}} = 26\,900\]
Answer: The one plant loads the treatment works like a town of more than 25,000 people.
Industrial dischargers and sampling
Industrial discharges are controlled at the source rather than at the plant. Under the Clean Water Act's national pretreatment program, the city runs an approved pretreatment program that prohibits substances that could harm workers, damage the sewers or pass through the plant, such as flammable liquids, high concentrations of metals and fats, oils and grease, and it applies EPA's categorical standards to specific industries. Significant industrial users hold permits that require them to sample their own effluent and report to the city, and the city samples them independently. The food processor pretreats its wastewater with screens and dissolved air flotation to remove fat and solids before discharge, and pays a surcharge on the BOD it sends. Dental offices must use amalgam separators under EPA's 2017 dental rule.
Good design data depend on good sampling. Grab samples show conditions at one moment; flow-proportional composite samples, made by combining small volumes taken at intervals in proportion to the flow, represent the daily load. Samples for BOD and nutrients must be refrigerated and analyzed within the holding times of the standard methods. Return streams from sludge processing, which enter the plant downstream of most samplers, must be measured separately or the loads on the biological process will be underestimated, a mistake lesson 11 returns to. Joy also checks the data for consistency: ratios such as COD to BOD₅ of about 2 and TKN to BOD₅ of about 0.2 are typical of municipal sewage, and a result far outside them prompts a resample.
Preliminary treatment
Preliminary treatment protects everything downstream. Screens remove rags, plastics, wipes and debris that would jam pumps and wrap around mixers; modern plants use fine screens with openings of 6 mm or less, cleaned mechanically, and wash and compact the screenings for landfill. Flushable wipes, which do not break down, have made fine screening and robust pumps essential. Grit chambers then remove sand, gravel and eggshells that would abrade pumps and fill tanks. They are designed, by the discrete settling of lesson 4, to settle grit particles of about 0.2 mm and larger while keeping lighter organic matter in suspension, either by controlling horizontal velocity near 0.3 m/s (1 ft/s) or by inducing a spiral flow in aerated or vortex chambers.
Flow measurement, commonly by a Parshall flume or magnetic flow meter, and composite samplers sit at the headworks. Odor control, by covering channels and treating the foul air in biofilters or chemical scrubbers, is now normal where plants have neighbors. Hydrogen sulfide gas from septic sewage is not only odorous but toxic; headworks buildings and wet wells are confined spaces or hazardous locations, requiring gas detection, ventilation, entry permits and trained crews, as CIV-280 and the safety courses describe.
Equalization basins store part of the daily peak flow and return it at night, flattening the load on downstream processes. They are most valuable at small plants and where industrial discharges arrive in slugs. Wet weather flows above the plant's secondary capacity may be stored, or given primary treatment and disinfection only, under the conditions of the license or permit; the goal of sewer separation and I/I reduction programs is to make such bypasses rare.
Plants serving rural areas also receive hauled wastes: septage pumped from household septic tanks, holding tank waste and portable toilet waste. Septage is many times stronger than sewage, with BOD₅ of several thousand mg/L and high grit, grease and ammonia, so it is received at a dedicated station with its own screen, a meter, a sampler and a holding tank, and fed to the plant slowly at night or sent directly to the digesters. Haulers are licensed and must record the source of each load, so that a load containing industrial waste or fuel can be traced. The city plant receives about 40 truckloads a week, and the upgrade includes a new receiving station with card-controlled access.
Primary treatment
Primary clarifiers are settling tanks that remove settleable solids and floating scum from the screened sewage, typically 50 to 70 % of TSS and 25 to 40 % of BOD₅. They are designed on overflow rates of about 30 to 50 m³/(m²·d) at average flow (800 to 1,200 gpd/ft²) and 80 to 120 m³/(m²·d) at peak flow, with depths of 3 to 5 m and detention times of 1.5 to 2.5 hours. Circular tanks with rotating scrapers and rectangular tanks with chain-and-flight collectors are both common. The primary sludge, at 2 to 6 % solids, is rich in energy and goes to the digesters of lesson 11.
The script sizes the primary clarifiers at about 980 gpd/ft² at average flow: about 8,100 ft² in three circular tanks of about 59 ft diameter. At the Harmon peak flow of about 17.5 MGD the overflow rate rises to about 2,200 gpd/ft², within the usual range. The plant's existing three clarifiers are 65 ft in diameter, so they are adequate, and the upgrade needs only new scraper drives and scum equipment.
Primary treatment has a trade-off in a nutrient removal plant. Removing more BOD in the primary tanks saves aeration energy and sends more energy-rich sludge to the digesters, but it also removes carbon that the denitrifying and phosphorus-accumulating bacteria of lesson 10 need. Some plants therefore bypass part of the flow around the primaries, or ferment primary sludge to produce volatile fatty acids that are returned to the biological process. The upgrade will keep the primaries but include a primary sludge fermenter as an option to be decided after the process model of lesson 12.
Worked problem
Primary effluent quality
With typical removals of 32 % of BOD₅, 60 % of TSS, 10 % of TKN and 12 % of phosphorus, what primary effluent does the plant send to the activated sludge process?
Show solution
- \[BOD_5:\ 220(1 - 0.32) = 150\ \text{mg/L}\]
- \[TSS:\ 240(1 - 0.60) = 96\ \text{mg/L}\]
- \[TKN:\ 45(1 - 0.10) = 40.5\ \text{mg/L};\quad TP:\ 7(1 - 0.12) = 6.2\ \text{mg/L}\]
Answer: These are the inputs to lessons 9 and 10. The nutrients pass almost entirely to the secondary process.
Chemically enhanced primary treatment
Adding a coagulant such as ferric chloride and a polymer ahead of the primary clarifiers, called chemically enhanced primary treatment, raises TSS removal to 80 to 90 % and BOD₅ removal to 50 to 60 %, and precipitates much of the phosphorus. It can delay the need for new secondary capacity, and it is useful in wet weather. Its costs are the chemicals and a larger sludge volume. For the city plant, Nadia keeps it as a wet weather option, because removing carbon year-round would starve the denitrification process.
Common mistakes
MistakeDesigning from domestic per capita loads when industry discharges to the sewer.
InsteadMeasure the actual influent and identify industrial contributions.
MistakeTreating headworks only as a mechanical problem.
InsteadHydrogen sulfide and confined spaces make gas detection, ventilation and entry procedures essential.
MistakeMaximizing primary BOD removal in a nutrient removal plant.
InsteadPreserve enough carbon for denitrification and biological phosphorus removal.
Summary and key terms
- Wastewater flow combines domestic, commercial, industrial, infiltration and inflow components and varies through the day and the year.
- The Harmon formula estimates peaking factors from population; measured data are preferred.
- Loads (kg/d or lb/d) are concentration times flow and drive biological process design.
- Screens and grit removal protect the plant; primary clarifiers remove 50 to 70 % of TSS and 25 to 40 % of BOD₅.
- Infiltration and inflow
- Groundwater and stormwater that enter a sanitary sewer.
- Peaking factor
- The ratio of peak to average flow.
- Total Kjeldahl nitrogen
- The sum of organic nitrogen and ammonia nitrogen.
- Population equivalent
- A load expressed as the number of people producing the same load.
- Grit
- Sand, gravel and other heavy inorganic particles in sewage.
- Primary sludge
- Solids settled in primary clarifiers.
- Chemically enhanced primary treatment
- Primary settling with added coagulant to increase removal.
Practice problems
Work each problem on paper first, then reveal the answer to check.
Find the Harmon peaking factor for a town of 9,000 people.
Show answer
\(1 + 14/(4 + 3) = 3.0\).
A plant receives 12,000 m³/d with BOD₅ of 180 mg/L. Find the BOD₅ load.
Show answer
\(180 \times 12\,000/1000 = 2\,160\) kg/d.
Why are grit chambers designed to keep the horizontal velocity near 0.3 m/s?
Show answer
Fast enough to keep organic solids in suspension, slow enough to let grit settle.
Give one reason to send part of the flow around the primary clarifiers in a nutrient removal plant.
Show answer
To keep readily biodegradable carbon for denitrification and phosphorus removal.
Lesson quiz · 5 questions
Score 60% or more to complete this lesson.
Create a free account to save your progress, take quizzes and earn a certificate.