
BUS-230 · Lesson 7 of 12 · 30 min
Quality management
Poor quality is expensive in ways that are easy to see and in ways that are not. Scrap, rework, warranty claims and product recalls show up in the accounts. Lost customers, damaged reputation, injuries and the hidden factory of people who spend their days finding and fixing errors usually do not. A single defective part can halt an assembly line, a single data entry error can deny someone a benefit payment, and a single contamination incident can close a food plant and harm hundreds of people. Quality management is the set of philosophies, systems and tools organizations use to deliver goods and services that meet customer requirements consistently and to improve them over time.
This lesson defines quality, introduces the leading quality thinkers, explains total quality management and the cost of quality, describes the ISO 9001 quality management standard and national quality awards, and presents the basic tools of quality problem solving. Statistical process control and Six Sigma, which provide the statistical engine of quality management, follow in lesson 8. Service quality from the customer's point of view, including the SERVQUAL model, is covered in BUS-220.
What is quality?
Quality has several meanings. From the customer's point of view, quality is fitness for use: how well the product or service does what the customer needs. From the producer's point of view, quality is conformance to specifications: making every unit as designed. David Garvin proposed eight dimensions of product quality: performance (primary operating characteristics), features (secondary characteristics), reliability (probability of failure in a given period), conformance (meeting specifications), durability (useful life), serviceability (ease and speed of repair), aesthetics (look, feel, sound) and perceived quality (reputation and brand). A product can rate highly on some dimensions and poorly on others, and different customers weigh them differently.
It helps to distinguish design quality from conformance quality. Design quality is decided by the features and performance built into the design, such as the materials, tolerances and options of a car; higher design quality usually costs more. Conformance quality is how well the product made matches the design; higher conformance usually costs less, because it reduces scrap, rework and warranty costs. Much of quality management focuses on conformance, but customer research must inform design quality.
| Dimension | Meaning | Example for a cordless drill | Example for a bank |
|---|---|---|---|
| Performance | Primary operating characteristics | Torque and battery life | Interest rates and speed of transactions |
| Features | Secondary characteristics | LED work light, belt clip | Mobile check deposit, budgeting tools |
| Reliability | Probability of operating without failure | Rarely fails in the first three years | App rarely goes down |
| Conformance | Matches specifications | Chuck runs true within tolerance | Statements accurate and on time |
| Durability | Useful life | Lasts ten years of regular use | Long-standing, stable relationship |
| Serviceability | Ease and speed of repair or recovery | Replaceable brushes, fast warranty service | Problems resolved on the first contact |
| Aesthetics | Look, feel and sound | Balanced grip, attractive design | Clean, welcoming branches and app design |
| Perceived quality | Reputation and image | Brand known for professional tools | Trusted name |
The quality pioneers
Modern quality management grew from the work of a handful of influential thinkers. Walter Shewhart at Bell Laboratories invented the control chart in the 1920s and the plan–do–study–act cycle of improvement. W. Edwards Deming took Shewhart's ideas to Japan after the Second World War and later to North America, arguing that most quality problems (he estimated 85 % or more) are caused by the system that management designs, not by individual workers. His fourteen points include creating constancy of purpose for improvement, ceasing dependence on mass inspection, ending the practice of awarding business on price alone, driving out fear and breaking down barriers between departments.
Joseph Juran defined quality as fitness for use and described the quality trilogy of planning, control and improvement; he also popularized the Pareto principle, that a vital few causes account for most problems. Philip Crosby argued that 'quality is free', because the costs of preventing defects are far lower than the costs of failure, and promoted the goal of zero defects. Kaoru Ishikawa developed the cause-and-effect (fishbone) diagram and championed quality circles, small groups of workers who meet to solve quality problems. Genichi Taguchi introduced the quality loss function and robust design: designing products and processes to perform well despite variation in materials and conditions.
Taguchi's loss function challenges the idea that any part within specification limits is equally good. He argued that loss to society increases with the square of the deviation from the target value, so a part just inside the tolerance is nearly as bad as one just outside it. The loss for a unit with measured value \(y\) and target \(T\) is:
Worked problem
Applying the Taguchi loss function
A shaft has a target diameter of 25.00 mm and a tolerance of ±0.05 mm. A shaft at the tolerance limit is expected to cause $40 of loss through poor fit, noise and early wear. Estimate the loss for shafts measuring 25.02 mm and 25.04 mm.
Show solution
- k = 40 ÷ 0.05² = 40 ÷ 0.0025 = 16,000.
- For 25.02 mm: L = 16,000 × 0.02² = 16,000 × 0.0004 = $6.40.
- For 25.04 mm: L = 16,000 × 0.04² = 16,000 × 0.0016 = $25.60.
- Both shafts are within specification, yet the second causes four times the loss of the first.
Answer: Losses are about $6.40 and $25.60. The loss function shows why reducing variation around the target creates value even when all parts already meet specifications.
Total quality management
Total quality management (TQM) is a management philosophy that makes quality the responsibility of everyone in the organization and focuses on continuous improvement of processes to satisfy customers. Its main principles are customer focus (quality is defined by customers, internal and external); continuous improvement (kaizen); employee involvement and empowerment, so that people closest to the work can identify and fix problems; process thinking, which treats outcomes as the result of processes that can be studied and improved; fact-based decision making using data and statistical tools; supplier partnership, building long-term relationships with fewer, better suppliers; and leadership commitment, because quality programs fail without visible support from the top.
Quality at the source means that each worker is responsible for the quality of their own work and has the authority to stop the process when something is wrong. Toyota's andon cord, which any worker can pull to stop the line when a problem appears, is the classic example. Error-proofing (poka-yoke), discussed in lesson 11, designs processes so that mistakes are impossible or immediately visible. Benchmarking compares an organization's processes and performance with those of the best performers, in or outside its industry, to set targets and find better practices.
The cost of quality
The cost of quality framework groups quality-related costs into four categories. Prevention costs are incurred to prevent defects: quality planning, training, design reviews, process capability studies and supplier development. Appraisal costs are incurred to detect defects: inspection, testing, audits and calibration of measuring equipment. Internal failure costs arise from defects found before the product reaches the customer: scrap, rework, downtime and re-inspection. External failure costs arise from defects found after delivery: warranty claims, returns, complaints, recalls, liability and lost future sales.
Studies regularly find that the total cost of quality in organizations without strong quality systems is large, often quoted as 15 to 25 % of sales in manufacturing and higher in some services, although estimates vary widely. Most of that cost is failure cost, and external failures are the most expensive per defect because they include lost goodwill. The lesson of the framework is that spending more on prevention usually reduces total cost, because each dollar of prevention avoids several dollars of appraisal and failure. Crosby's 'quality is free' is a statement about this trade-off.
Worked problem
Cost of quality analysis
A maker of kitchen appliances with annual sales of $10 million records: prevention $40,000; appraisal $90,000; internal failure $210,000; external failure $360,000. Management proposes spending an extra $60,000 a year on supplier development and operator training, expected to cut internal and external failure costs by 30 % and allow appraisal costs to fall by $20,000. Evaluate the proposal.
Show solution
- Current total cost of quality = 40,000 + 90,000 + 210,000 + 360,000 = $700,000, or 7.0 % of sales; failure costs are 81 % of the total.
- New prevention = $100,000; new appraisal = $70,000.
- New failure costs = 0.70 × (210,000 + 360,000) = 0.70 × 570,000 = $399,000.
- New total = 100,000 + 70,000 + 399,000 = $569,000, or 5.7 % of sales.
- Net saving = 700,000 − 569,000 = $131,000 a year from a $60,000 investment.
Answer: The proposal cuts the cost of quality by about $131,000 a year, a return of more than twice the extra prevention spending, before counting the value of happier customers.
ISO 9001 and quality awards
ISO 9001, published by the International Organization for Standardization, specifies requirements for a quality management system (QMS). It does not prescribe a quality level for products; rather, it requires organizations to understand their context and customers, plan for risks and opportunities, control processes and documents, measure performance, audit themselves, review the system at the leadership level and improve it continually. Organizations can be certified by accredited third-party registrars, and certification is often a requirement for suppliers to large manufacturers and governments. Sector standards build on it, such as IATF 16949 for automotive suppliers, AS9100 for aerospace and ISO 13485 for medical devices.
The standard was revised in 2026. As of October 2026, certification bodies report that ISO 9001:2026 was published in September 2026 with a transition period of about three years for certified organizations, ending around September 2029. The revision keeps the high-level structure of the 2015 edition while adding emphasis on quality culture and ethical behavior, separating requirements on risks and opportunities, and adding consideration of climate change. Organizations certified to ISO 9001:2015 should check transition deadlines with their registrar. Related standards include ISO 14001 for environmental management and ISO 45001 for occupational health and safety, often combined into an integrated management system.
National quality awards recognize organizations with outstanding quality and performance management systems and publish frameworks that others use for self-assessment. In the United States, the Malcolm Baldrige National Quality Award, created by Congress in 1987 and managed by the National Institute of Standards and Technology with the Baldrige Foundation, recognizes organizations in business, health care, education, non-profit and government sectors; two health care organizations received the 2025 award in early 2026. The Baldrige Excellence Framework assesses leadership, strategy, customers, measurement and knowledge management, workforce, operations and results. Many organizations use the framework for improvement without ever applying for the award.
The basic tools of quality
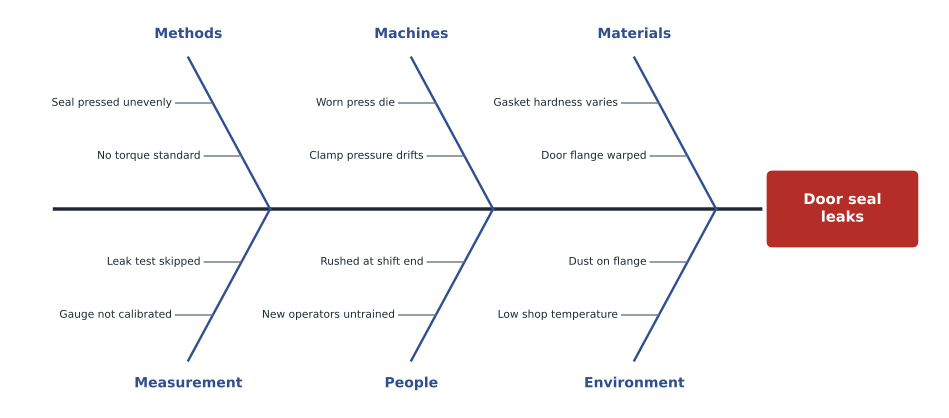
Ishikawa argued that most quality problems can be solved with seven simple tools that any employee can learn. A check sheet is a form for collecting data on the frequency of events, such as types of defects by hour. A histogram shows the distribution of a measured variable, revealing its center, spread and shape. A Pareto chart ranks problem categories from most to least frequent with a cumulative percentage line, focusing effort on the vital few. A cause-and-effect (fishbone or Ishikawa) diagram organizes possible causes of a problem into categories, commonly the six Ms: methods, machines, materials, measurement, manpower (people) and Mother Nature (environment). A scatter diagram plots two variables to reveal relationships. A flowchart maps the process (lesson 3). A control chart tracks a process over time to distinguish normal from unusual variation (lesson 8).
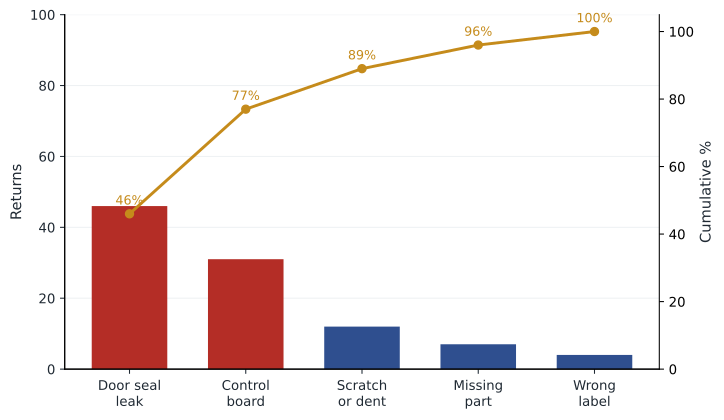
# Pareto analysis of 100 appliance returns by cause
causes = {"door seal leak": 46, "control board fault": 31, "scratch or dent": 12,
          "missing part": 7, "wrong label": 4}
total = sum(causes.values())
cum = 0
print(f"{'cause':<20}{'count':>6}{'share':>8}{'cumulative':>12}")
for cause, n in sorted(causes.items(), key=lambda x: -x[1]):
    cum += n
    print(f"{cause:<20}{n:>6}{n/total:>8.0%}{cum/total:>12.0%}")
vital = [c for c in causes if causes[c] >= 0.2 * total]
print("Vital few:", ", ".join(vital))cause count share cumulative door seal leak 46 46% 46% control board fault 31 31% 77% scratch or dent 12 12% 89% missing part 7 7% 96% wrong label 4 4% 100% Vital few: door seal leak, control board fault
The analysis shows that door seal leaks and control board faults together account for 77 % of returns. A team would focus first on these two causes, using a fishbone diagram to brainstorm possible causes of seal leaks, check sheets and scatter diagrams to test which causes are real, and the plan–do–study–act cycle to try and confirm solutions. Fixing scratches or labels may be easy, but it would remove only a small share of the problem.
The improvement cycle and quality in services
The plan–do–study–act (PDSA) cycle, also called plan–do–check–act (PDCA), structures improvement. Plan: identify the problem, analyze causes and plan a change. Do: try the change on a small scale. Study: measure the results and compare them with predictions. Act: adopt the change and standardize it if it worked, or abandon or adjust it and repeat the cycle if not. The cycle never ends; each turn raises the standard. Six Sigma's DMAIC method (lesson 8) is a more structured version of the same logic.
Services face particular quality challenges: output is intangible, customers participate, and service is often produced and consumed at the same moment, so there is no chance to inspect it before delivery. Service firms therefore emphasize prevention through careful service design, hiring and training, standard procedures and checklists, and service recovery when things go wrong. Checklists have had striking effects in health care: the World Health Organization's surgical safety checklist, introduced in 2008, was associated with significant reductions in complications and deaths in its original multi-country study. Service guarantees, such as a promise to refund a hotel night if a problem is not fixed, both reassure customers and force the firm to fix the root causes of failures.
Common mistakes
MistakeTreating quality as the quality department's job.
InsteadMake quality everyone's responsibility, with authority to stop the process when problems appear.
MistakeRelying on final inspection to achieve quality.
InsteadBuild quality in through prevention, capable processes and quality at the source.
MistakeAssuming any part within specification is equally good.
InsteadReduce variation around the target; losses grow as parts move away from it.
MistakeBlaming individual workers for most defects.
InsteadStudy the system; most problems come from methods, equipment, materials and management.
MistakeSpending improvement effort on the easiest problems.
InsteadUse Pareto analysis to tackle the vital few causes first.
MistakeSeeing ISO 9001 certification as proof of excellent products.
InsteadCertification shows a working management system; product quality still needs measurement and improvement.
Summary and key terms
- Quality means fitness for use and conformance to specifications; Garvin lists eight dimensions.
- Design quality sets what a product can do; conformance quality is how consistently it is made to the design.
- Shewhart, Deming, Juran, Crosby, Ishikawa and Taguchi shaped modern quality management.
- Taguchi's loss function shows that loss grows with the square of deviation from target.
- TQM emphasizes customers, continuous improvement, employee involvement, process thinking and data.
- The cost of quality includes prevention, appraisal, internal failure and external failure costs; prevention usually lowers the total.
- ISO 9001 sets requirements for a quality management system; a 2026 revision was published with a transition period to about 2029.
- National awards and frameworks, such as Excellence Canada's and Baldrige, support self-assessment.
- The seven basic tools and the PDSA cycle support everyday problem solving.
- Fitness for use
- Juran's definition of quality as how well a product meets the customer's needs.
- Conformance quality
- The degree to which a product matches its design specifications.
- Total quality management
- A philosophy making quality everyone's responsibility and focusing on continuous improvement.
- Quality at the source
- Making each worker responsible for the quality of their own output.
- Cost of quality
- The total of prevention, appraisal, internal failure and external failure costs.
- Quality loss function
- Taguchi's model in which loss increases with the square of deviation from target.
- ISO 9001
- An international standard specifying requirements for a quality management system.
- Pareto chart
- A bar chart ranking problem categories by frequency, with a cumulative line.
- Cause-and-effect diagram
- A diagram organizing possible causes of a problem into categories.
- PDSA cycle
- The plan–do–study–act cycle of continuous improvement.
Practice problems
Work each problem on paper first, then reveal the answer to check.
Give two of Garvin's quality dimensions for a smartphone.
Show answer
Performance (processor speed) and reliability (rarely crashes); others are acceptable.
Why does higher conformance quality usually lower cost?
Show answer
It reduces scrap, rework, inspection and warranty costs.
What did Deming estimate about the source of most quality problems?
Show answer
That most (85 % or more) come from the system, which management controls.
Target 10.0 mm, tolerance ±0.2 mm, loss at the limit $8. What is k?
Show answer
8 ÷ 0.04 = 200.
Using that k, what is the loss for a part at 10.1 mm?
Show answer
200 × 0.01 = $2.
Classify: training operators; warranty repairs; scrap; incoming inspection.
Show answer
Prevention; external failure; internal failure; appraisal.
Why are external failures usually the most expensive?
Show answer
They include repair, returns, liability and lost customers and reputation.
What does ISO 9001 certification show, and what does it not show?
Show answer
A functioning quality management system; it does not guarantee a particular product quality level.
Which tool would you use to rank complaint categories?
Show answer
A Pareto chart.
Portfolio task: draw a fishbone diagram for a quality problem you have experienced as a customer.
Show answer
Answers vary; causes grouped under methods, machines, materials, measurement, people and environment.
Lesson quiz · 5 questions
Score 60% or more to complete this lesson.
Create a free account to save your progress, take quizzes and earn a certificate.