
BUS-230 · Lesson 2 of 12 · 29 min
Operations strategy
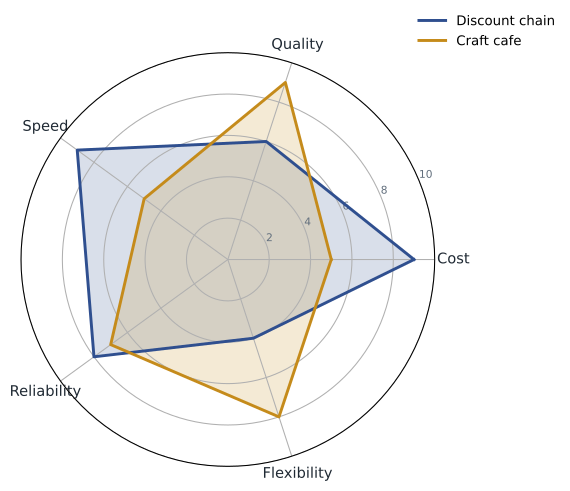
Two coffee chains can sell similar drinks and yet run very different operations. One competes on low prices and speed: a narrow menu, automated espresso machines, a drive-through lane designed for under three minutes per car and suppliers chosen for cost. The other competes on experience and craft: hand-poured drinks, a changing menu of single-origin beans, comfortable seating and baristas trained for weeks. Neither is wrong, but each must build an operation that delivers what its customers value. Operations strategy is the set of decisions about the operations function that supports the organization's overall strategy and builds the capabilities it needs to compete.
This lesson explains how operations strategy connects to corporate and business strategy, the competitive priorities operations can deliver, the distinction between order winners and order qualifiers, the trade-offs operations managers face, and tools for choosing between process alternatives. Strategic management as a whole is covered in BUS-450; here the focus is on what operations must do to make a strategy real.
From mission to operations strategy
Strategy cascades through levels. The mission states why the organization exists and whom it serves. Corporate strategy decides which businesses to be in. Business strategy decides how each business will compete: on low cost, on differentiation, or by focusing on a niche. Functional strategies, including the operations strategy, translate the business strategy into concrete choices. If a business strategy says 'we will win busy professionals with the fastest, most reliable home delivery of groceries', the operations strategy must decide where to place fulfillment centers, how much capacity to hold, which delivery technology to use, how to pick orders accurately and how to staff for peaks.
Operations strategy works in both directions. Top-down, it supports the chosen business strategy. Bottom-up, it can create capabilities that open new strategic options: a firm that develops an exceptionally fast and flexible production system may be able to offer customization that competitors cannot match. The resource-based view of strategy emphasizes such capabilities, which are valuable, rare and hard to imitate because they are built from many interlocking routines rather than any single machine. Toyota's production system is the classic example: competitors could visit its plants for decades and still struggle to copy it.
Competitive priorities
Operations can help a firm compete through a small set of competitive priorities, sometimes called performance objectives. Cost means producing at low unit cost, which allows low prices or high margins. Quality includes both design quality (the features and performance a product is designed to have) and conformance quality (making every unit to specification). Time includes delivery speed (how quickly an order is filled), delivery reliability (keeping promises) and development speed (how quickly new products reach the market). Flexibility includes the ability to customize, to change volume up or down, and to change the product mix. Many firms now add sustainability and innovation as distinct priorities.
| Priority | What it means to customers | Operations capabilities needed | Typical measures |
|---|---|---|---|
| Cost | Low price or good value | Scale, efficient processes, low waste, low-cost sourcing | Unit cost, productivity, scrap rate |
| Quality | Products that work and match the specification | Capable processes, training, quality systems | Defect rate, returns, customer satisfaction |
| Delivery speed | Short wait from order to receipt | Fast processes, inventory near customers, spare capacity | Order lead time, queue time |
| Delivery reliability | Promises kept | Stable processes, good planning and scheduling | On-time delivery rate |
| Flexibility | Customization, range, quick response to changes | Flexible equipment, cross-trained staff, short changeovers | Changeover time, range offered, response time |
| Sustainability | Lower environmental and social impact | Energy-efficient processes, responsible sourcing, circular design | Emissions per unit, waste diverted, supplier audits |
No operation can be best at everything at once, so the strategy must say which priorities matter most for target customers. A discount retailer emphasizes cost and availability; a luxury watchmaker emphasizes design quality; a hospital emergency department emphasizes speed and quality of care; a contract electronics maker emphasizes flexibility and reliability. Operations strategy is largely about choosing which priorities to excel at, which to be merely adequate at, and aligning every decision area with those choices.
Order winners and order qualifiers
Terry Hill's distinction between order winners and order qualifiers sharpens the analysis. Order qualifiers are the characteristics a product must have even to be considered by customers. Falling below the qualifying level loses orders, but exceeding it does not win more. Order winners are the characteristics that cause customers to choose one supplier over another; improving them wins more business. For a grocery chain, food safety and a clean store are qualifiers; price, convenience or product range may be the winners. Order losers are qualifiers that have fallen below standard: a supplier with a sudden spate of late deliveries can lose orders it would otherwise win on price.
Winners and qualifiers change over time and differ by market segment. When a product is new, design and features often win orders; as it matures and competitors catch up, those features become qualifiers and price and availability become the winners. In the early years of smartphones, camera quality and app stores won orders; today a good camera is a qualifier in most price bands. A firm serving two segments may face different winners in each, which can justify separate operations, a strategy known as plant-within-a-plant.
Worked problem
Identifying order winners for an industrial supplier
A maker of custom metal brackets surveys lost and won bids over a year. It wins most bids where its price is within 5 % of the lowest bidder and it can promise delivery in under 10 days. It loses almost every bid where it cannot meet the customer's quality certification, regardless of price. Classify these factors and suggest an operations priority.
Show solution
- Quality certification is an order qualifier: without it the firm is not considered, but having it does not win the order.
- Price within a band is partly a qualifier: bids far above the lowest lose, but being the very cheapest is not necessary.
- Delivery in under 10 days appears to be the order winner, because it differentiates winning bids among qualified suppliers.
- Operations priority: keep certification and costs competitive, but invest in faster delivery, for example by shortening changeovers and holding common raw materials.
Answer: Certification and competitive price are qualifiers; fast delivery is the order winner. The firm should focus improvement on speed while protecting its qualifiers.
Trade-offs, focus and the sand cone
Wickham Skinner argued in 1969 that operations involves trade-offs: a plant designed for very low cost through long production runs of standard products will struggle to offer variety and fast changes, and a plant designed for flexibility will struggle to match the lowest costs. He recommended the focused factory, a plant that concentrates on a limited set of tasks, products or markets so that its whole operation can be aligned with one set of priorities. A hospital that specializes in hernia repairs, such as the Shouldice Hospital near Toronto, is a well-known service example: by doing one procedure in a standardized way, it achieves high quality and efficiency.
Trade-offs are real at any moment, but they are not fixed. The efficient frontier represents the best performance combinations current technology and practice allow; a firm inside the frontier can improve several priorities at once by eliminating waste. Lean producers in the 1980s showed that high quality and low cost could go together. Ferdows and De Meyer's sand cone model suggests a sequence for building lasting capability: first quality, then reliability, then speed, then cost efficiency, with each layer resting on the one beneath. Like sand, each higher layer requires a broader base; cutting costs by sacrificing quality tends to collapse.
Strategy through the product life cycle and in services
Operations priorities often shift over a product's life cycle. In the introduction stage, designs change often, volumes are low and flexibility and development speed matter most. In growth, capacity, reliability and quality become critical as demand outruns supply. In maturity, cost and efficiency dominate as competitors offer similar products. In decline, firms reduce capacity, cut costs and may outsource. An operations strategy should anticipate these shifts, for example by planning to move a product from a flexible pilot line to a dedicated high-volume line as demand grows.
In services, the degree of customer contact shapes strategy. High-contact services, such as hotels and clinics, must manage the customer experience directly and cope with customer-induced variability. Many service firms separate a front office, where customers are present and flexibility and courtesy matter, from a back office, where work can be standardized and run for efficiency, such as payment processing at a bank or food preparation in a central kitchen. Technology increasingly shifts tasks to customers through self-service kiosks and apps, which can cut costs and speed service but must be designed so customers can succeed without help.
Choosing between processes: crossover analysis
Operations strategy often comes down to choosing between process alternatives with different cost structures. A manual process has low fixed costs but high variable costs per unit; an automated process has high fixed costs but low variable costs. BUS-110 covers break-even analysis for a single product; crossover analysis extends it by finding the volume at which two alternatives have equal total cost. Below that volume the lower-fixed-cost option is cheaper; above it the lower-variable-cost option wins.
Here \(F_1\) and \(v_1\) are the fixed cost and variable cost per unit of the option with lower fixed cost, and \(F_2\) and \(v_2\) those of the option with higher fixed cost. The analysis is only as good as the volume forecast, so managers usually test how sensitive the choice is to forecast error and consider non-cost factors such as quality, flexibility and the risk of being locked into expensive equipment if demand falls.
Worked problem
Choosing a process for a new product
A food processor can pack a new snack three ways. Manual packing costs $50,000 a year in fixed costs plus $0.30 a bag. Semi-automatic packing costs $120,000 plus $0.18 a bag. A fully automatic line costs $300,000 plus $0.10 a bag. Forecast demand is 1.2 million bags a year. Which process is cheapest, and over what ranges?
Show solution
- Manual versus semi-automatic: Q* = (120,000 − 50,000) ÷ (0.30 − 0.18) = 70,000 ÷ 0.12 ≈ 583,000 bags.
- Semi-automatic versus automatic: Q* = (300,000 − 120,000) ÷ (0.18 − 0.10) = 180,000 ÷ 0.08 = 2,250,000 bags.
- Below about 583,000 bags manual is cheapest; between 583,000 and 2.25 million, semi-automatic; above 2.25 million, automatic.
- At 1.2 million bags: manual $410,000; semi-automatic $336,000; automatic $420,000.
- If demand were expected to grow beyond 2.25 million within a few years, the firm might choose the automatic line or plan an upgrade path.
Answer: Semi-automatic packing is cheapest at the forecast of 1.2 million bags, saving $74,000 a year over manual packing and $84,000 over the automatic line.
# Crossover analysis: total annual cost of three packing processes
options = {"manual": (50_000, 0.30), "semi-auto": (120_000, 0.18), "automatic": (300_000, 0.10)}

def total(name, q):
    fixed, var = options[name]
    return fixed + var * q

for q in [250_000, 600_000, 1_200_000, 2_000_000, 3_000_000]:
    costs = {n: total(n, q) for n in options}
    best = min(costs, key=costs.get)
    row = "  ".join(f"{n}: ${c:>9,.0f}" for n, c in costs.items())
print(f"{q:>9,} bags {row} -> {best}")250,000 bags manual: $ 125,000 semi-auto: $ 165,000 automatic: $ 325,000 -> manual 600,000 bags manual: $ 230,000 semi-auto: $ 228,000 automatic: $ 360,000 -> semi-auto 1,200,000 bags manual: $ 410,000 semi-auto: $ 336,000 automatic: $ 420,000 -> semi-auto 2,000,000 bags manual: $ 650,000 semi-auto: $ 480,000 automatic: $ 500,000 -> semi-auto 3,000,000 bags manual: $ 950,000 semi-auto: $ 660,000 automatic: $ 600,000 -> automatic
The table confirms the ranges: manual wins at low volume, semi-automatic in the middle and automatic only at very high volume. Plotting total cost lines against volume gives the same answer visually; the lowest line at each volume marks the preferred process.
Weighing strategic alternatives
Many operations decisions involve several criteria that cannot all be turned into dollars. A factor-rating (weighted scoring) model lists the criteria, assigns weights that sum to 1, scores each alternative on each criterion, and computes a weighted total. The method makes judgments explicit and encourages discussion of the weights, which reflect the strategy. It is used for choosing processes, suppliers (lesson 12) and locations (lesson 5). Its weakness is that scores are subjective, so teams should test whether the ranking changes when weights change.
| Criterion | Weight | Keep in-house (score 1–10) | Outsource to contract maker (score 1–10) |
|---|---|---|---|
| Unit cost | 0.30 | 6 | 8 |
| Quality control | 0.25 | 9 | 6 |
| Flexibility for design changes | 0.20 | 8 | 5 |
| Capital required | 0.15 | 4 | 9 |
| Protection of know-how | 0.10 | 9 | 4 |
| Weighted total | 1.00 | 7.15 | 6.65 |
In the example, keeping production in-house scores 0.30 × 6 + 0.25 × 9 + 0.20 × 8 + 0.15 × 4 + 0.10 × 9 = 1.80 + 2.25 + 1.60 + 0.60 + 0.90 = 7.15, and outsourcing scores 2.40 + 1.50 + 1.00 + 1.35 + 0.40 = 6.65. Arithmetic slips are common when such models are done by hand, which is one reason teams build them in a spreadsheet. The in-house option leads because quality, flexibility and know-how carry substantial weight. If the firm's strategy shifted toward cost leadership, raising the weights on unit cost and capital and lowering those on quality and know-how, outsourcing could come out ahead, showing how the strategy drives the operations choice.
Common mistakes
MistakeTrying to be the best at every competitive priority at once.
InsteadChoose the priorities that win orders with target customers, and be adequate on the rest.
MistakeInvesting to exceed an order qualifier that customers already consider adequate.
InsteadMeet qualifiers reliably, then invest in order winners.
MistakeAssuming trade-offs are permanent.
InsteadFirms inside the efficient frontier can improve several priorities at once by removing waste.
MistakeCutting quality to reduce cost.
InsteadBuild quality and reliability first; lasting cost improvements rest on them.
MistakeChoosing a process on cost at today's volume only.
InsteadUse crossover analysis across the expected range of volumes and check sensitivity to forecast error.
MistakeTreating weighted scores as objective facts.
InsteadDiscuss the weights openly and test whether the ranking changes when they change.
Summary and key terms
- Operations strategy aligns operations decisions with the business strategy and builds hard-to-imitate capabilities.
- Competitive priorities include cost, quality, speed, reliability, flexibility and sustainability.
- Order qualifiers get a firm considered; order winners make customers choose it; order losers are qualifiers that slip.
- Winners and qualifiers change over the product life cycle and differ by segment.
- Skinner's focused factory aligns a plant with a limited set of tasks and priorities.
- Firms inside the efficient frontier can improve several priorities at once; the sand cone builds quality, then reliability, speed and cost.
- Service strategy depends on customer contact; front and back offices can be managed differently.
- Crossover analysis finds the volume at which two process alternatives cost the same.
- Factor rating weighs non-financial criteria; the weights should reflect the strategy.
- Operations strategy
- The decisions about the operations function that support the business strategy and build capabilities.
- Competitive priorities
- The dimensions, such as cost, quality, time and flexibility, on which operations helps a firm compete.
- Order qualifier
- A characteristic a product must have to be considered by customers.
- Order winner
- A characteristic that causes customers to choose one supplier over others.
- Focused factory
- A plant that concentrates on a limited set of products, processes or markets.
- Efficient frontier
- The best combinations of performance achievable with current technology and practice.
- Sand cone model
- The idea that capabilities should be built in sequence: quality, reliability, speed, then cost.
- Crossover point
- The volume at which two alternatives have equal total cost.
- Factor rating
- A weighted scoring method for comparing alternatives on several criteria.
- Core competency
- A capability that gives a firm a lasting competitive advantage.
Practice problems
Work each problem on paper first, then reveal the answer to check.
List four competitive priorities and a measure for each.
Show answer
Cost: unit cost; quality: defect rate; speed: lead time; flexibility: changeover time.
For a hospital, name an order qualifier and an order winner for elective surgery.
Show answer
Qualifier: accreditation and safety record; winner: short wait time or a surgeon's reputation.
Why might a feature that once won orders become a qualifier?
Show answer
Competitors copy it, so customers come to expect it.
Process A costs $40,000 plus $6 a unit; process B $100,000 plus $3. Find the crossover.
Show answer
60,000 ÷ 3 = 20,000 units.
In the same case, which process is cheaper at 15,000 units?
Show answer
Process A: $130,000 versus $145,000.
What does the sand cone model recommend building first?
Show answer
Quality.
Give an example of a front-office and a back-office activity at a bank.
Show answer
Front: advising a customer on a mortgage; back: processing loan documents.
What is a focused factory?
Show answer
A plant dedicated to a limited set of products or tasks so it can align with one set of priorities.
Why should weights in a factor-rating model be tested?
Show answer
They are subjective, and the ranking may change if they change.
Portfolio task: compare the competitive priorities of two firms in one industry and explain how their operations differ.
Show answer
Answers vary; link priorities to process, capacity, location and staffing choices.
Lesson quiz · 5 questions
Score 60% or more to complete this lesson.
Create a free account to save your progress, take quizzes and earn a certificate.