
BAS-320 · Lesson 3 of 12 · 22 min
Building graphics that operators can use
▶ Video coming soon A video version of this lesson is on the way.
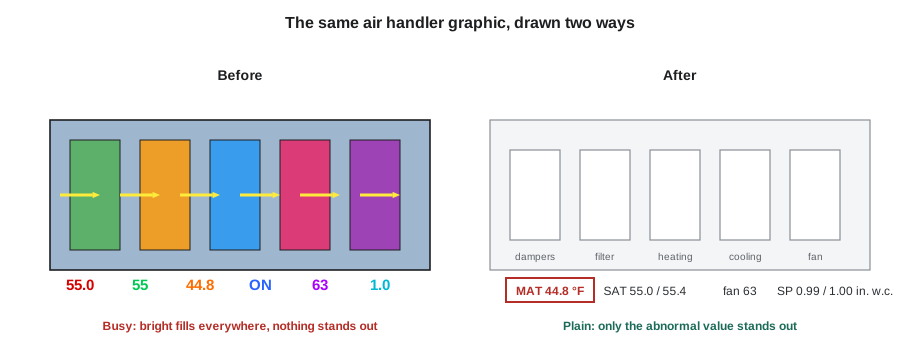
For the third Monday evening, September 28, Sophie put two pictures of the same air handler side by side on the projector. The left one was Tilden Hall's AHU-1 graphic as it had been drawn in 2009: a three-dimensional cutaway of the unit in bright blue and silver, spinning fan blades, animated airflow arrows, red and green dots for every status, and numbers in six colors scattered across the picture. The right one was a draft Sophie had made over the weekend: a flat, plain diagram in shades of gray, with every value in the same dark text and nothing colored at all. "Which one tells you something is wrong?" she asked. Callie looked for a long time at the left one. On the right, one value had a small amber box round it: the mixed air temperature was low.
What a graphic is for
A graphic is not a picture of the equipment. It is a tool that lets an operator answer, quickly and correctly, three questions: is everything normal; if not, what is wrong; and what can I do about it? A beautiful picture that hides the answer to those questions is a bad graphic. A plain diagram that makes the answer obvious is a good one.
Process industries learned this the hard way. Investigations after several accidents in refineries and chemical plants found that operators had been looking at screens full of color and movement and had missed the one value that mattered. The result was a body of practice called high-performance HMI, where HMI means human-machine interface, written up in the standard ANSI/ISA-101.01-2015 on human-machine interfaces for process automation systems. Buildings are less dangerous than refineries, but their operators face the same problem: hundreds of points, a few of which matter at any moment.
Principles of a high-performance graphic
| Principle | In practice |
|---|---|
| Neutral background | A light or medium gray background, not black, white or a photograph |
| Color only for abnormal | Normal values and running equipment are shown in grays; color is kept for alarms and abnormal states |
| Few colors, used consistently | For example, red for high-priority alarms, amber for lower priorities, and one color for manual or overridden points, across every page |
| No decoration | No three-dimensional shading, spinning fans, flowing water or photographs of equipment |
| Analog over digital where it helps | A bar or indicator showing a value against its normal range, not just a number |
| Show the relationship | Setpoint beside the measured value; command beside the status |
| Show data quality | Mark values that are stale, faulty, out of service or overridden |
| Consistent layout | Same symbols, same places, same text sizes on every page of the same type |
Color carries the meaning in this approach, so it has to be rationed. If running fans are green, closed valves red and setpoints blue, an operator's eye has nothing left to catch when something is actually wrong. Sophie's palette for Quillon's graphics used grays for equipment and normal values, dark text for numbers, red for urgent alarms, amber for other alarms and a light blue outline for points held at an operator priority, and nothing else. "If you want a color for something new," she told Callie, "you have to take one away."
Movement follows the same rule. An animated fan is moving whether the real fan is running or not, as long as the graphic thinks it is, so it shows the operator nothing a plain status would not, and it draws the eye away from the values. The draft AHU-1 graphic showed the fan as a simple symbol with the word ON and the measured speed beside it.
Analog indicators
A number on its own asks the operator to remember what it should be. 61.2 °F for a mixed air temperature might be fine or worrying, depending on the season, the setpoint and the alarm limits. An analog indicator shows the number against its range: a short bar with the normal band shaded, the setpoint marked, the alarm limits drawn as ticks, and a pointer at the current value. An operator glancing at a page of indicators can see which pointers are outside their bands without reading a single number.
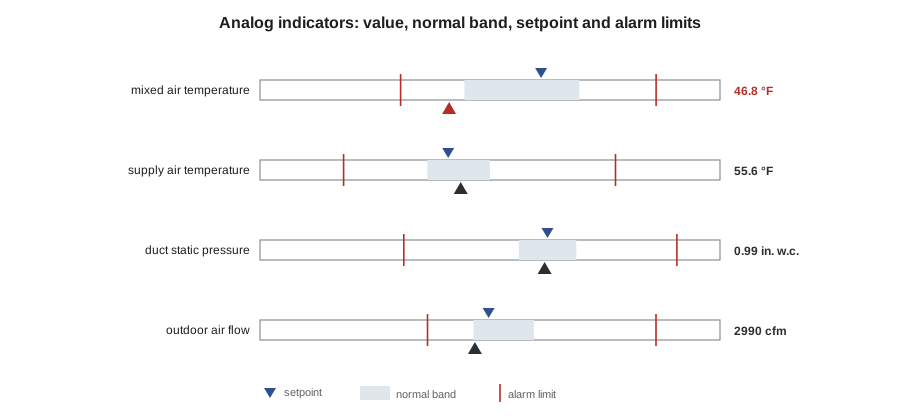
Indicators work best for values whose normal range is known and fairly steady: supply air temperature, duct static pressure, chilled water temperature, building pressure. They are less useful for values that range widely in normal operation, such as outdoor air temperature, where a plain number is enough. Sophie used them on the summary row at the top of each air handler page, so that an operator saw four or five key values first, then the diagram below.
Showing what the operator needs to see
Three pairs of values deserve to be shown together on every equipment graphic, because the difference between them is often the whole story.
| Show | Beside | Because |
|---|---|---|
| Measured value | Its setpoint | An operator can see the error, as in BAS-130, without opening anything |
| Command | Status or feedback | A fan commanded on but not proven running, or a valve commanded closed but reading 40 open, is a fault |
| Loop output | The device position | A loop at 100 with a valve feedback of 0 points to a stuck or disconnected actuator |
Room 108 in November was an example. The VAV-1-08 reheat valve was commanded closed and its actuator agreed, but the discharge air was far above the supply air. No graphic at the time showed the valve command beside the discharge air temperature and the supply temperature; anyone looking would have had to open three pages. Sophie's draft template for VAV boxes, which she sketched for Callie at the end of the evening, put all three in one row.
Data quality: is the value real?
BAS-310 showed that every BACnet point carries Status_Flags, Reliability and Out_Of_Service properties. A good graphic uses them. A value from a sensor with an open circuit, a point that an operator has overridden, a point taken out of service for testing and a value the server has not been able to read for ten minutes all look like ordinary numbers unless the graphic marks them.
| Condition | Where it comes from | How Quillon marks it |
|---|---|---|
| Fault | Status_Flags FAULT, or Reliability not NO_FAULT_DETECTED | Value replaced by dashes with a small FAULT label |
| Overridden or held at an operator priority | Status_Flags OVERRIDDEN, or an active value at priority 8 | Light blue outline and a hand symbol |
| Out of service | Out_Of_Service true | Value in italics with OOS beside it |
| Stale | The front end has not received a new value within its expected time | Value faded, with the time of the last good value on hover |
| Device offline | No response to reads | Whole equipment symbol faded, with OFFLINE |
The override marking matters most in practice. When Callie ran Tilden's override report on November 14 and found 14 points still at priority 8, several of them were on graphics that showed them as ordinary values. Two VAV boxes had been held at maximum airflow since a summer heat wave, and nothing on their pages said so. Sophie's draft graphics would show each of them with a light blue outline from the moment it was written.
Accessibility
Graphics are read by people with ordinary eyesight on ordinary monitors, sometimes on a laptop in a bright plant room, sometimes on a phone. They are also read by the large number of people who do not see color the way the designer does. Red-green color vision deficiency affects roughly 1 in 12 men of northern European descent and far fewer women, so a graphic that uses red and green alone to mean stopped and running is unreadable to some operators. High-performance graphics avoid the problem by using shape, text and position as well as color: an alarm has a colored box and a priority number, not just a color.
Text contrast matters too. The web accessibility guidelines, WCAG 2.2, ask for a contrast ratio of at least 4.5 to 1 between ordinary text and its background, and 3 to 1 for large text and for graphical objects that carry meaning. The ratio is calculated from the relative luminance of the two colors, which design tools work out from their color codes.
Worked problem
Checking the contrast of a gray palette
Sophie's background gray has a relative luminance of 0.6939. Her value text is a dark gray with a luminance of 0.0331, and her label text was a mid gray with a luminance of 0.2159. The contrast ratio is (lighter + 0.05) ÷ (darker + 0.05). Do both pass the 4.5 to 1 guideline for ordinary text?
Show solution
- \[\text{values: } \frac{0.6939 + 0.05}{0.0331 + 0.05} = \frac{0.7439}{0.0831} = 8.95\]
- \[\text{labels: } \frac{0.6939 + 0.05}{0.2159 + 0.05} = \frac{0.7439}{0.2659} = 2.80\]
Answer: The values pass easily at 8.95 to 1; the labels fail at 2.80 to 1. Sophie darkened the label gray, which is the usual fix: a gray palette needs dark text, not mid-gray text, to be readable.
Size follows from where the graphic will be read. Text smaller than about 12 pixels is hard to read on a plant-room laptop, and values that matter should be larger than their labels. Pages designed for a 27-inch monitor in the operator's office should be checked on a laptop and, if operators will use them, on a phone.
Equipment page layout
Sophie's equipment pages followed the same layout every time, so that an operator who learned one air handler page could read any other.
- A title bar with the equipment name, its location and the page's place in the navigation.
- A summary row of analog indicators for the four or five values that matter most.
- A simple diagram of the equipment, in the direction air or water actually flows, with each sensor's value and setpoint beside it.
- A status column: mode, occupancy, enable, alarms active on this equipment, and any overrides.
- Links to the equipment's trends, schedule, alarm history and documentation.
Air on every air handler page flowed from left to right, outdoor air entering at the top left, with the return below. Water on every plant page flowed from the left, supply above return. These conventions sound trivial, but they let an operator's eye go straight to the right place, and they let a technician who has never seen the building read its graphics on the first visit.
When the graphic and the building disagree
The last point Sophie made that evening was about trust. A graphic is a claim about the building, and operators soon stop believing one that is often wrong. Values that never change, equipment shown running when it is off, alarms that are always active: each teaches the operator to ignore the screen. The cure is partly in the graphic, with data quality markings, and partly in maintenance: sensors that are calibrated, points that are released, alarms that mean something, which is the subject of lesson 5.
Callie's homework was to mark up a printout of Tilden's existing AHU-2 graphic with every principle it broke. She found 23 before she gave up counting, starting with the spinning fan and ending with a supply air temperature that had been displayed in the wrong units since 2009.
Reviewing a graphic before handover
Graphics are easy to make and hard to get right, so Quillon reviews every new graphic against a short checklist before an owner sees it. Sophie gave Callie the list that evening, and Callie used it the following week on the draft AHU-1 page.
| Check | Question to ask |
|---|---|
| Purpose | Can an operator tell in five seconds whether this equipment is normal? |
| Color | Is color used only for alarms, abnormal states and overrides? |
| Values | Does every measured value have its setpoint or normal band beside it? |
| Pairs | Are command and status, and loop output and device position, shown together? |
| Quality | Do fault, overridden, out-of-service, stale and offline points look different from normal ones? |
| Units | Are the units correct and shown once, clearly? |
| Text | Is the text large enough and dark enough to read on a laptop? |
| Commands | Can an operator change only what they should, within limits, with the result confirmed? |
| Links | Does the page link to trends, the schedule, the alarm history and the sequence? |
| Accuracy | Has every value been checked against the controller and, where possible, the field? |
The commands row deserves a word. Every value an operator can change from a graphic, a setpoint, a schedule, a manual command, is a way of changing the building, so a graphic should only offer commands that the operator's role allows, and should limit them to a safe range. A zone setpoint offered with no limits will sooner or later be set to 86 °F by someone who is cold, and a box held at maximum airflow by someone who is hot, which is how two of Tilden's boxes spent the summer. Lesson 7 covers roles and permissions in detail; on the graphic itself, Sophie set every adjustable setpoint with a minimum and a maximum agreed with the owner.
Common mistakes
MistakeUsing color for normal states such as running fans.
InsteadKeep normal states gray and save color for abnormal conditions.
MistakeAnimating fans, pumps and airflow.
InsteadShow status and measured values; animation adds nothing and distracts.
MistakeShowing values without setpoints or ranges.
InsteadPut the setpoint beside the value, or use an analog indicator with the normal band.
MistakeHiding overrides and bad data.
InsteadMark fault, overridden, out-of-service, stale and offline points clearly.
MistakeRelying on color alone.
InsteadAdd text, shape or position so color-blind operators can read the page.
MistakeUsing mid-gray text on a gray background.
InsteadCheck contrast and use dark text for values and labels.
Summary and key terms
- A graphic should show at a glance whether things are normal, what is wrong and what to do.
- High-performance graphics use neutral backgrounds and keep color for abnormal states.
- Analog indicators show a value against its normal band, setpoint and alarm limits.
- Show measured value with setpoint, command with status, and loop output with device position.
- Use Status_Flags, Reliability and Out_Of_Service to mark data quality.
- Design for color-blind operators and check text contrast against WCAG guidance.
- Use the same layout and flow direction on every page of the same type.
- HMI
- Human-machine interface: the screens people use to watch and run a system.
- High-performance graphic
- A graphic designed to make abnormal conditions stand out, with neutral colors and little decoration.
- Analog indicator
- A small scale showing a value against its normal band and limits.
- Normal band
- The range in which a value is expected to stay during normal operation.
- Data quality
- Whether a displayed value is current, valid and under normal control.
- Stale value
- A value the front end has not been able to update within its expected time.
- Contrast ratio
- A measure of how distinct text is from its background, calculated from relative luminance.
Practice problems
Work each problem on paper first, then reveal the answer to check.
Why should a running fan not be shown in green on a high-performance graphic?
Show answer
Normal states should be neutral so that color can mark what is abnormal.
Text luminance 0.05 on background 0.70: what is the contrast ratio?
Show answer
(0.70 + 0.05) ÷ (0.05 + 0.05) = 7.5 to 1.
Which three pairs of values belong together on a graphic?
Show answer
Measured value and setpoint; command and status; loop output and device position.
How should a point held at priority 8 look?
Show answer
Clearly marked as overridden, for example with an outline and a symbol.
What does a value faded with its last update time mean in Quillon's scheme?
Show answer
It is stale: the front end has not received a new value in time.
Lesson quiz · 5 questions
Score 60% or more to complete this lesson.
Create a free account to save your progress, take quizzes and earn a certificate.