
AWS-122 · Lesson 7 of 12 · 20 min
Risk management for AI initiatives
▶ Video coming soon A video version of this lesson is on the way.
Lorraine liked registers. Every serious risk at Cascade Ridge, from a power failure at the emergency hospital to a key supplier going out of business, was in one, with an owner, a score and a response. "So where's AI?" she asked at the start of the sixth session. It was not there. The sixth session built the AI part of the register and, with it, a way of deciding how much control each AI use needed.
What is different about AI risk
AI systems share the ordinary risks of any technology: outages, security breaches, cost overruns, vendor failure. They also bring risks of their own. Their outputs are probabilistic, so they will sometimes be wrong. Their performance can change over time without anyone touching them, as the world they model changes. They can treat groups of people unequally. Generative systems can invent facts, produce harmful content or reproduce material someone else owns. And people tend to trust a fluent, confident answer more than they should.
Domain 3 of the exam guide has a task on identifying enterprise AI risks and directing their mitigation. It asks you to recognize the need for risk controls and monitoring of AI systems in production; to understand that bias can arise at several stages of the life cycle and why monitoring for bias drift matters; to manage risks from harmful content and intellectual property concerns; and to identify and mitigate reliability risks such as hallucinations, degrading data quality and model drift. Another task asks you to apply AI risk classification frameworks to prioritize governance and compliance decisions across the life cycle.
A catalog of AI risks
| Risk | What it means | Typical mitigation |
|---|---|---|
| Hallucination | A generative system states something false or unsupported as if it were true | Ground answers in approved sources; grounding checks; human review; narrow scope |
| Model drift | Performance falls because the data or the world has changed since training | Monitor performance against a baseline; retrain or recalibrate on a schedule or trigger |
| Data quality degradation | Inputs become incomplete, late or wrong, for example after a system change | Data quality checks on inputs; alerts; data owners |
| Bias and bias drift | Outputs are unjustifiably worse or different for some groups, at launch or over time | Check outcomes by group before launch and in production; adjust use or model |
| Harmful content | Outputs that are offensive, dangerous or inappropriate | Content filters and guardrails; denied topics; testing with adversarial prompts |
| Intellectual property | Outputs that copy protected material, or use of data without the right to use it | Approved models and terms; review of generated marketing content; data licenses checked |
| Privacy and security | Personal data exposed, misused or retained too long; prompt injection or misuse of tools | Least-privilege access, encryption, data minimization, logging, guardrails on inputs |
| Over-reliance | People accept outputs without checking | Training, review time, audit samples, labeling drafts as drafts |
| Vendor and lock-in | A provider changes terms, prices or models, or fails | Portable evaluation sets; exit terms; second option assessed |
Bias needs a closer look because it can enter at many points. It can come from the data used to train a model, if past decisions were themselves unequal or if some groups are under-represented. It can come from the choice of what the model predicts: predicting who will miss an appointment is not the same as predicting who needs help to attend. It can come from how outputs are used: the same flag could trigger a friendly extra reminder or a demand for a deposit. And it can appear later, as bias drift, when the population changes and a model that was fair at launch stops being fair. That is why the exam guide stresses ongoing monitoring rather than a single check before launch.
A fairness check in practice
Before approving the no-show pilot, the steering group asked Noor to check whether the model flagged clients at rural clinics more often than clients at city clinics. Rural clients travel further, and bad winter roads cause more missed appointments, so some difference was expected. The question was whether the difference was large enough to matter, and what the flag would lead to.
Worked problem
Comparing flag rates between groups
In the test data, the model flags 14 out of every 100 bookings at rural clinics and 9 out of every 100 at city clinics. Compare the two rates and decide what the steering group should do.
Show solution
- Compute the ratio of the lower rate to the higher rate: 9 ÷ 14 = 0.64.
- Compare with a common screening rule of thumb: if one group's rate is below about four-fifths (0.8) of another's, the difference deserves a closer look.
- Here 0.64 is below 0.8, so the difference is worth examining. Being flagged here leads to a helpful extra reminder, but the rate gap still needs explaining.
- Check whether the difference reflects real attendance: in the same data, rural no-shows were about 11 in 100 bookings and city no-shows about 6 in 100, so the model is largely tracking a real difference.
- Consider the use: a flag leads only to an extra reminder and a friendlier offer to rebook, never to a deposit, a refusal or a lower priority. Being flagged does not disadvantage anyone.
Answer: The difference in flag rates mostly reflects a real difference in missed appointments, and the action triggered by a flag helps rather than penalizes. The group approved the pilot on two conditions: flags would never be used to refuse, charge or deprioritize anyone, and flag rates and outcomes by clinic type would be reported monthly to catch bias drift.
The rule of thumb used in the example is only a screening device, not a legal test or a guarantee of fairness. Its value is that it prompts a question: why is there a difference, and does the use of the output harm anyone? The answer depends on the use. The same gap in flag rates would have been unacceptable if a flag meant paying a deposit.
Scoring risks
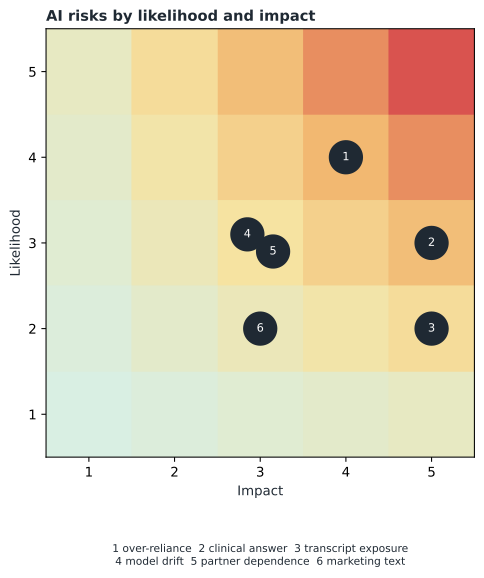
Lorraine's register used a familiar method: score each risk for likelihood and impact on a scale of 1 to 5, multiply them, and sort by the result. Scores of 15 or more were high and needed a named response and monthly review; 8 to 14 were medium, reviewed quarterly; 7 or less were low. Andre and Hannah added the AI risks.
| Risk | Likelihood (1 to 5) | Impact (1 to 5) | Score | Level |
|---|---|---|---|---|
| Staff accept AI drafts without checking them | 4 | 4 | 16 | High |
| Assistant gives an unsupported clinical answer | 3 | 5 | 15 | High |
| Client details exposed through call transcripts | 2 | 5 | 10 | Medium |
| No-show model drifts after a booking system change | 3 | 3 | 9 | Medium |
| Dependence on the partner for the assistant | 3 | 3 | 9 | Medium |
| Generated marketing text copies protected material | 2 | 3 | 6 | Low |
Worked problem
Ranking the AI risks
Calculate the score for each risk, assign its level and say which two need monthly attention.
Show solution
- Over-reliance: 4 × 4 = 16. Unsupported clinical answer: 3 × 5 = 15.
- Transcript exposure: 2 × 5 = 10. Model drift: 3 × 3 = 9. Partner dependence: 3 × 3 = 9. Marketing text: 2 × 3 = 6.
- High is 15 or more: over-reliance (16) and unsupported clinical answers (15).
- Medium is 8 to 14: transcript exposure (10), drift (9) and partner dependence (9). Low is 7 or less: marketing text (6).
Answer: Over-reliance on AI drafts and unsupported clinical answers are the two high risks needing monthly review. The highest risk is a human behavior, not a technical fault. Its response is training, review time and audit samples, from lesson 4 and lesson 6.
Scores like these are judgments, and two people can disagree by a point. That is acceptable. The value of scoring is that it forces the conversation, makes priorities visible, and lets the register be reviewed as conditions change. Transcript exposure has a low likelihood only because of controls already planned, such as processing in approved services with restricted access; if those controls slipped, its score would rise.
Risk classification frameworks
Scoring individual risks is useful, but organizations also need a way to classify whole AI uses by their level of risk, so that the right amount of governance is applied to each. The exam guide asks you to apply AI risk classification frameworks to prioritize governance and compliance decisions across the life cycle. Several public frameworks help. The European Union's AI Act sorts systems into unacceptable, high, limited and minimal risk, with obligations rising by level. The NIST AI Risk Management Framework in the United States organizes risk work into four functions: govern, map, measure and manage. ISO/IEC 42001 sets out requirements for an AI management system that an organization can be certified against. None of these was written for a veterinary group, but their logic transfers.
Cascade Ridge adopted three internal tiers, based on who could be affected, how badly, and how quickly a mistake would be caught.
| Tier | Typical features | Required governance | Examples |
|---|---|---|---|
| Tier 1: low | Internal use, no personal or clinical decisions, errors easy to spot | Owner named; listed in the register; literacy training; periodic review | Review-comment themes; drafting internal notices |
| Tier 2: medium | Affects clients or staff indirectly, or uses personal data, with human action before any effect | Responsible AI checklist; privacy review; monitoring plan; quarterly report | No-show reminders; lab-value extraction with confirmation |
| Tier 3: high | Touches clinical information or decisions, or communicates directly with clients without review | Full risk review; clinical sign-off; human in the loop; audits; incident plan; steering group approval | Call-note summaries; client-support assistant |
A tier is assigned at intake, reviewed before the pilot, and reviewed again whenever the use changes. Changing the assistant to answer clinical questions, for example, would move part of it into a more demanding category and trigger a new review. Classification across the life cycle means exactly that: the tier follows the use, not the technology, and it is checked each time the use or the context changes.
Monitoring in production
Many AI risks only show themselves after launch. The exam guide asks you to recognize the need for controls and monitoring of AI systems in production. Each initiative needed a short monitoring plan naming what would be watched, how often, by whom, and what would trigger action.
| Initiative | What is monitored | Trigger for action |
|---|---|---|
| No-show reminders | Recall and precision monthly; flag rates and outcomes by clinic type; input data completeness | Recall falls below 0.55; flag-rate ratio falls below 0.6; missing booking fields above 2 in 100 |
| Lab-value extraction | Share of values confirmed without change; errors found in audits | Errors in audits above 1 in 200 values |
| Call-note summaries | Audit of 20 drafts a week; edits per draft; reported omissions | Any clinically important omission; edit rate rising for three weeks |
| Client-support assistant | Grounding check failures; hand-off completeness; complaints | Any clinical question answered without hand-off; complaints about wrong answers |
AWS provides tools that support this kind of monitoring, such as Amazon SageMaker Model Monitor for tracking data and model quality, SageMaker Clarify for bias metrics, Amazon CloudWatch for alarms, and the logging built into Amazon Bedrock. A business strategist does not need to configure them, but should know that monitoring is a planned, funded activity with an owner, not something that happens by itself.
Incidents
Some risks will occur despite the controls. An AI incident is an event in which an AI system caused or nearly caused harm, such as a wrong clinical answer, a data exposure or an unfair outcome. Cascade Ridge folded AI incidents into its existing incident process, with three additions: anyone could report an AI concern through a simple form; each AI system's owner would be told within a working day; and the steering group would review every AI incident and near miss, with the lessons fed into training and into the system's monitoring plan. The receptionist's email from lesson 6 was recorded as the first near miss.
Common mistakes
MistakeTreating bias as something checked once before launch.
InsteadBias can enter at many stages and drift over time; monitor outcomes by group in production.
MistakeAssuming the biggest AI risks are technical.
InsteadOver-reliance and misuse by people are often the highest risks; treat them with training, review time and audits.
MistakeApplying the same governance to every AI use.
InsteadClassify uses into risk tiers and scale controls to the tier, reviewing the tier when the use changes.
MistakeLaunching without a monitoring plan.
InsteadName what is monitored, how often, by whom and what triggers action.
Summary and key terms
- AI adds risks such as hallucination, model drift, data quality degradation, bias and bias drift, harmful content, intellectual property problems, privacy and security threats, over-reliance and vendor lock-in.
- Bias can arise in data, problem framing and use, and must be monitored over time.
- A simple screening ratio can prompt fairness questions, but the use of the output decides whether a difference is harmful.
- Likelihood-by-impact scoring prioritizes risks.
- Risk classification frameworks such as the EU AI Act, the NIST AI RMF and ISO/IEC 42001 inform internal risk tiers that scale governance to the use.
- Production monitoring and an incident process complete the picture.
- Model drift
- Falling performance because data or the world has changed since a model was built.
- Bias drift
- A model becoming less fair over time as the population or context changes.
- Hallucination
- A generative AI output that states unsupported or false information as fact.
- Risk score
- Likelihood multiplied by impact, used to rank risks.
- Risk tier
- A classification of an AI use that sets the level of governance it needs.
- AI incident
- An event in which an AI system caused or nearly caused harm.
Practice problems
Work each problem on paper first, then reveal the answer to check.
A risk has likelihood 3 and impact 4. What is its score and level on the Cascade Ridge scale?
Show answer
3 × 4 = 12, which is medium (8 to 14).
Group A is flagged at 20 in 100 and group B at 12 in 100. What is the ratio, and does it pass the four-fifths screen?
Show answer
12 ÷ 20 = 0.6, which is below 0.8, so it deserves a closer look.
Name three public frameworks that help classify or manage AI risk.
Show answer
The EU AI Act, the NIST AI Risk Management Framework and ISO/IEC 42001.
Lesson quiz · 5 questions
Score 60% or more to complete this lesson.
Create a free account to save your progress, take quizzes and earn a certificate.