
AI-110 · Lesson 5 of 12 · 32 min
Data frames with pandas
Most data that feeds AI systems arrives as tables: rows of records with named columns of different types. A table of customers has names (text), sign-up dates (dates), plans (categories) and monthly spend (numbers). A log of sensor readings has timestamps, device identifiers and measurements. NumPy arrays hold one type of number in a grid; they have no column names, no mixed types and no natural way to handle dates or missing values. For tables, Python has pandas.
Pandas provides the DataFrame, a table with labeled rows and columns in which each column can have its own type, and a large set of tools to load, clean, filter, combine, group, summarize and reshape such tables. Industry surveys consistently rank it among the most used tools in data science, and in practice a large share of any AI project's time goes into exactly this kind of data preparation. This chapter covers the operations you will use every day. The examples use pandas 2.2 or later; text columns appear as "object" in pandas 2 and as "str" in pandas 3, but everything shown works the same in both.
Series and DataFrames
Pandas has two main objects:
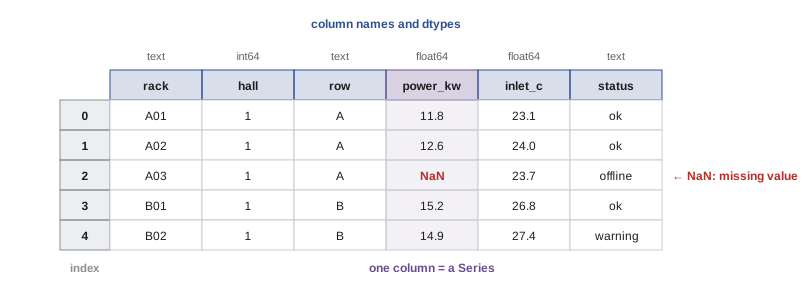
- A Series is a one-dimensional array of values with an index (labels for each value). It is like a NumPy array with names attached, and it is what you get when you select one column of a table.
- A DataFrame is a two-dimensional table: a collection of Series sharing the same index, one per column. Each column has a name and a dtype.
The index labels the rows. By default it is simply 0, 1, 2 and so on, but it can be anything meaningful, such as rack identifiers or timestamps. Labels let pandas align data automatically: when two Series are added, values are matched by label, not by position.
Loading data
Pandas reads data from many formats: pd.read_csv for comma-separated text, pd.read_excel for spreadsheets, pd.read_json, pd.read_parquet for the efficient columnar format used in data engineering, and pd.read_sql for databases. CSV is the most common. The example below reads a small CSV of rack measurements from a string (via io.StringIO, which makes a string behave like a file) so that the program is self-contained; with a real file you would write pd.read_csv("racks.csv").
import io
import pandas as pd

csv_text = """rack,hall,row,power_kw,inlet_c,status
A01,1,A,11.8,23.1,ok
A02,1,A,12.6,24.0,ok
A03,1,A,,23.7,offline
B01,1,B,15.2,26.8,ok
B02,1,B,14.9,27.4,warning
C01,2,C,9.4,21.9,ok
C02,2,C,10.1,22.5,ok
C03,2,C,18.7,28.9,warning
"""
df = pd.read_csv(io.StringIO(csv_text))
print(df.shape)
print(df.head(3))
print(df["power_kw"].describe().round(2))(8, 6) rack hall row power_kw inlet_c status 0 A01 1 A 11.8 23.1 ok 1 A02 1 A 12.6 24.0 ok 2 A03 1 A NaN 23.7 offline count 7.00 mean 13.24 std 3.25 min 9.40 25% 10.95 50% 12.60 75% 15.05 max 18.70 Name: power_kw, dtype: float64
The first look at any new data set follows the same routine: df.shape for the number of rows and columns, df.head() to see a few rows, df.info() for column types and non-missing counts, and df.describe() for summary statistics of numeric columns. Notice that read_csv did several things automatically. It used the first line as column names, worked out that hall is an integer and power_kw a float, and turned the empty power_kw value for rack A03 into NaN ("not a number"), pandas' marker for a missing value. The count of 7 in describe() shows that one of the eight values is missing and was left out of the statistics.
Selecting, filtering and new columns
Pandas offers several ways to select data, and it is worth learning the clear, explicit ones:
- df["power_kw"] selects one column as a Series; df[["rack", "power_kw"]] (note the double brackets) selects several columns as a DataFrame.
- df.loc[rows, columns] selects by label: df.loc[3, "inlet_c"], or df.loc[df["hall"] == 2, ["rack", "inlet_c"]].
- df.iloc[rows, columns] selects by integer position, like NumPy: df.iloc[0:3, 1:4].
- A Boolean mask in brackets filters rows: df[df["inlet_c"] > 25].
New columns are created by assigning a vectorized expression, exactly as with NumPy arrays.
import io
import pandas as pd

df = pd.read_csv(io.StringIO("""rack,hall,row,power_kw,inlet_c,status
A01,1,A,11.8,23.1,ok
A02,1,A,12.6,24.0,ok
A03,1,A,,23.7,offline
B01,1,B,15.2,26.8,ok
B02,1,B,14.9,27.4,warning
C01,2,C,9.4,21.9,ok
C02,2,C,10.1,22.5,ok
C03,2,C,18.7,28.9,warning
"""))
hot = df[df["inlet_c"] > 25]                      # filter rows with a mask
print(hot[["rack", "power_kw", "inlet_c"]])
df["inlet_f"] = df["inlet_c"] * 9 / 5 + 32        # new column, vectorized
print(df.loc[df["hall"] == 2, ["rack", "inlet_f"]])
print(df.sort_values("power_kw", ascending=False).head(3)["rack"].tolist())rack power_kw inlet_c 3 B01 15.2 26.8 4 B02 14.9 27.4 7 C03 18.7 28.9 rack inlet_f 5 C01 71.42 6 C02 72.50 7 C03 84.02 ['C03', 'B01', 'B02']
Filtering keeps the original index labels (3, 4 and 7), which tells you where each row came from. Conditions combine with & and |, with parentheses around each one, as in NumPy: df[(df["hall"] == 1) & (df["status"] != "ok")]. The method df.query("inlet_c > 25 and hall == 1") expresses the same thing as a readable string.
Grouping and aggregation
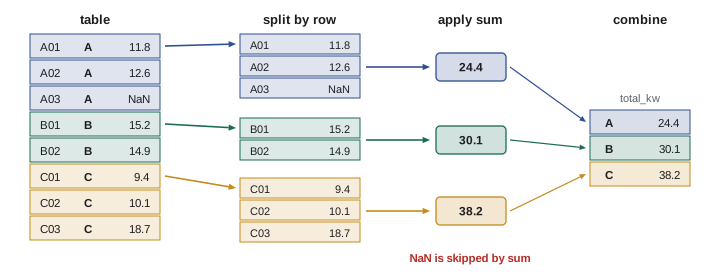
Many questions about data take the form "for each group, compute something": total power per row, average temperature per hall, number of alarms per day. Pandas answers them with groupby, which follows a pattern called split-apply-combine: split the rows into groups by the values of one or more columns, apply a summary function to each group, and combine the results into a new table.
import io
import pandas as pd

df = pd.read_csv(io.StringIO("""rack,hall,row,power_kw,inlet_c,status
A01,1,A,11.8,23.1,ok
A02,1,A,12.6,24.0,ok
A03,1,A,,23.7,offline
B01,1,B,15.2,26.8,ok
B02,1,B,14.9,27.4,warning
C01,2,C,9.4,21.9,ok
C02,2,C,10.1,22.5,ok
C03,2,C,18.7,28.9,warning
"""))
by_row = df.groupby("row").agg(racks=("rack", "count"),
                               total_kw=("power_kw", "sum"),
                               max_inlet=("inlet_c", "max"))
print(by_row)
print(df.groupby("hall")["power_kw"].mean().round(2))
print(df["status"].value_counts())racks total_kw max_inlet row A 3 24.4 24.0 B 2 30.1 27.4 C 3 38.2 28.9 hall 1 13.62 2 12.73 Name: power_kw, dtype: float64 status ok 5 warning 2 offline 1 Name: count, dtype: int64
The agg method with named aggregations (new_name=(column, function)) produces tidy, clearly labeled results. Note that row A has 3 racks but its total uses only the two with readings, because sum skips NaN. The hall 1 mean of 13.62 kW is likewise the average of the four racks with readings, not five. value_counts is the quickest way to see how often each category occurs, and it is one of the first things to run on any categorical column.
Worked problem
Reading a group summary carefully
Using the rack table, a manager reads the summary above and says: "Hall 1 averages 13.6 kW per rack across 5 racks, so its total load is 68 kW." What is wrong, and what is the correct total?
Show solution
- Hall 1 has 5 racks, but A03 is offline with no reading (NaN), so the mean of 13.62 kW is over 4 racks.
- Correct total of measured load: \(11.8 + 12.6 + 15.2 + 14.9 = 54.5\) kW.
- Multiplying the 4-rack mean by 5 racks invents a reading for A03 equal to the average: \(13.62 \times 5 = 68.1\) kW.
- The right question is what A03 actually draws. If it is truly offline, its load is near zero and the hall total is 54.5 kW.
Answer: The total is 54.5 kW of measured load, not 68 kW. Group statistics silently skip missing values, so always check counts (df.groupby("hall")["power_kw"].count()) alongside means and sums.
Missing data
Missing values are the norm in real data: sensors fail, forms are left incomplete, systems are offline. Pandas represents them as NaN for numbers (and NaT for missing dates), and provides tools to find and handle them (Lesson 6 discusses how to decide which to use):
- df.isna() returns a mask of missing values; df.isna().sum() counts them per column.
- df.dropna() removes rows with missing values (subset= restricts which columns to check).
- df.fillna(value) replaces missing values, for example with a constant, a column mean or the previous value (ffill).
- s.interpolate() estimates missing values in a series from their neighbors, which suits smoothly varying measurements over time.
import io
import pandas as pd

df = pd.read_csv(io.StringIO("""rack,hall,row,power_kw,inlet_c,status
A01,1,A,11.8,23.1,ok
A02,1,A,12.6,24.0,ok
A03,1,A,,23.7,offline
B01,1,B,15.2,26.8,ok
"""))
print(df["power_kw"].isna().sum(), "missing")
print(round(df["power_kw"].mean(), 2))             # NaN is skipped
print(round(df["power_kw"].fillna(0).mean(), 2))   # treating missing as zero
print(df.dropna(subset=["power_kw"])["rack"].tolist())1 missing 13.2 9.9 ['A01', 'A02', 'B01']
The two means differ by a third, which shows why the choice matters. There is no universally right answer: it depends on why the data is missing. If the rack is offline, zero is correct for energy totals; if its meter failed while the rack ran normally, zero badly understates the load and skipping or interpolating is better. Whatever you choose, make it a deliberate decision, write it down, and check how much it changes the results. In machine learning, how missing values are filled can also leak information or bias a model, a topic covered in AI-220.
Combining tables
Data usually lives in several tables that must be joined: measurements in one, equipment details in another, customer information in a third. The merge method joins two DataFrames on matching key columns, like a database join:
- how="inner" keeps only rows whose key appears in both tables.
- how="left" keeps every row of the left table, filling NaN where the right table has no match.
- how="outer" keeps every row from both.
import pandas as pd

racks = pd.DataFrame({"rack": ["A01", "A02", "B01", "C01"],
                      "customer_id": [7, 7, 12, 31],
                      "power_kw": [11.8, 12.6, 15.2, 9.4]})
customers = pd.DataFrame({"customer_id": [7, 12, 40],
                          "name": ["Northwind", "Bluebird AI", "Cedar Labs"]})
merged = racks.merge(customers, on="customer_id", how="left")
print(merged)
print(merged.groupby("name")["power_kw"].sum())rack customer_id power_kw name 0 A01 7 11.8 Northwind 1 A02 7 12.6 Northwind 2 B01 12 15.2 Bluebird AI 3 C01 31 9.4 NaN name Bluebird AI 15.2 Northwind 24.4 Name: power_kw, dtype: float64
Rack C01 belongs to customer 31, who is missing from the customer table, so the left join gives it a NaN name, and the groupby then drops it from the totals without any warning. A careful analyst checks for unmatched keys after every merge (for example with merged["name"].isna().sum()) because a silent loss of rows like this is one of the most common causes of wrong numbers in reports. The validate argument of merge can also enforce expectations, such as each rack matching at most one customer. pd.concat, by contrast, stacks tables with the same columns on top of each other, for example a month of daily files.
Time series
Measurements over time are central to engineering and AI: sensor logs, energy use, transactions, web traffic. Pandas has strong support for them. pd.to_datetime converts text to timestamps; pd.date_range creates regular sequences of times; and a Series or DataFrame with a DatetimeIndex gains time-aware tools. resample changes the frequency (hourly to daily, for example) with an aggregation, and rolling computes moving-window statistics such as a 24-hour moving average.
import numpy as np
import pandas as pd

rng = np.random.default_rng(1)
times = pd.date_range("2026-07-01", periods=7 * 24, freq="h")    # one week, hourly
hours = times.hour.to_numpy()
load = 800 + 120 * np.sin((hours - 9) / 24 * 2 * np.pi) + rng.normal(0, 15, len(times))
s = pd.Series(load, index=times, name="it_load_kw")

daily = s.resample("D").agg(["mean", "max"]).round(1)
print(daily.head(3))
print(s.rolling(24).mean().dropna().round(1).iloc[:2])
print("peak hour:", s.idxmax())mean max 2026-07-01 801.7 929.0 2026-07-02 796.2 921.6 2026-07-03 799.3 918.9 2026-07-01 23:00:00 801.7 2026-07-02 00:00:00 799.8 Freq: h, Name: it_load_kw, dtype: float64 peak hour: 2026-07-07 16:00:00
The program simulates a week of hourly IT load with a daily cycle (peaking in the afternoon) plus random noise. Resampling to daily frequency gives each day's mean and peak. The 24-hour rolling mean needs 24 values before it can produce its first result, so the first 23 entries are NaN, which dropna removes; the first full window ends at 23:00 on 1 July. Rolling means smooth out the daily cycle to reveal longer trends, a standard first step before forecasting.
Worked problem
From readings to an energy bill
A meter records power every 15 minutes in a Series s (kW) with a DatetimeIndex covering a 30-day month. Describe pandas operations that give (a) the energy each day in kWh, (b) the month's peak 15-minute demand and when it happened, and (c) how many 15-minute intervals are missing.
Show solution
- (a) Each reading represents 0.25 h, so energy per reading is s * 0.25 kWh. Daily energy: (s * 0.25).resample("D").sum().
- (b) Peak demand: s.max(); its timestamp: s.idxmax().
- (c) A complete month has \(30 \times 96 = 2880\) intervals. Missing count: s.isna().sum() plus any timestamps absent entirely, found by comparing len(s) with 2880 (or reindexing to a full pd.date_range).
Answer: (s * 0.25).resample("D").sum() for daily kWh; s.max() and s.idxmax() for the peak; 2880 − s.count() for missing intervals, after reindexing to the full range so absent rows count too. Missing intervals must be handled before the daily sums are trusted.
Tidy data and method chaining
Analysis is easiest when data is "tidy": each variable is a column, each observation is a row, and each kind of observational unit is its own table. A spreadsheet with one column per month is not tidy, because the month is a variable hiding in the column names; df.melt reshapes it into long form with a month column and a value column, and df.pivot_table reshapes the other way for reports. Pandas code is also often written as a chain of methods, one per line, which reads like a recipe:
- (df.query("status == 'ok'").groupby("row")["power_kw"].sum().sort_values(ascending=False))
Each step returns a new DataFrame, so the original is unchanged, and the chain documents exactly how a result was produced.
Performance and scale
Pandas keeps the whole table in memory and works best on data up to a few gigabytes. As with NumPy, vectorized column operations are fast and row-by-row loops (iterrows, or apply with a Python function) are slow, so prefer column expressions. For larger data, the Parquet file format loads faster and smaller than CSV, and libraries such as Polars, DuckDB and Spark handle data sets that are too large or too slow for pandas while keeping similar ideas.
Common mistakes
MistakeTrusting means and sums without checking how many values were missing.
InsteadCheck counts with .count() or .isna().sum(); aggregations skip NaN silently.
MistakeFilling every missing value with zero by habit.
InsteadDecide based on why the data is missing (offline, failed meter, not applicable) and record the choice.
MistakeMerging tables without checking for unmatched keys.
InsteadAfter a merge, look for NaN in the joined columns and compare row counts; use validate= to enforce expectations.
MistakeLooping over rows with iterrows to compute a new column.
InsteadUse vectorized column expressions, which are far faster.
MistakeSelecting multiple columns with single brackets, df["a", "b"].
InsteadUse a list inside the brackets: df[["a", "b"]].
Summary and key terms
- A DataFrame is a table of named columns (Series), each with its own dtype, sharing a row index.
- Start every data set with shape, head, info and describe, and check what read_csv inferred.
- Select with df["col"], df[["a", "b"]], .loc (labels) and .iloc (positions); filter rows with Boolean masks or query.
- groupby follows split-apply-combine; named aggregations with agg give clear summary tables.
- Missing values (NaN) are skipped by aggregations; handling them is a deliberate, documented decision.
- merge joins tables on keys (inner, left, outer); always check for unmatched keys.
- Time series tools include to_datetime, date_range, resample and rolling.
- Prefer tidy data, method chains and vectorized operations; move to Parquet, Polars or DuckDB when data outgrows pandas.
- Series
- A one-dimensional labeled array; one column of a DataFrame.
- DataFrame
- A two-dimensional table of labeled columns that may have different types.
- Index
- The labels of a Series or of the rows of a DataFrame.
- NaN
- "Not a number": pandas' and NumPy's marker for a missing numeric value.
- .loc / .iloc
- Selection by label and by integer position.
- Boolean indexing
- Selecting rows with a True/False mask.
- groupby
- Splitting rows into groups by key values to summarize each group.
- Split-apply-combine
- The pattern of splitting data into groups, applying a function and combining the results.
- Aggregation
- Reducing many values to one, such as a sum, mean, count or maximum.
- merge (join)
- Combining two tables by matching key columns.
- Left join
- A join that keeps every row of the left table, filling missing matches with NaN.
- DatetimeIndex
- An index of timestamps that enables time-based selection and resampling.
- Resample
- Changing the frequency of a time series, aggregating or filling as needed.
- Rolling window
- A moving window over consecutive values used to compute statistics such as a moving average.
- Tidy data
- A layout with one variable per column, one observation per row and one unit type per table.
- Parquet
- A compressed, column-oriented file format for efficient storage and loading of tables.
Practice problems
Work each problem on paper first, then reveal the answer to check.
Write the code to load "sensors.csv", treating the text "error" as missing, and show the number of missing values in each column.
Show answer
df = pd.read_csv("sensors.csv", na_values=["error"]); df.isna().sum().
Using the rack table, which racks are in hall 1 with status other than "ok"?
Show answer
df[(df["hall"] == 1) & (df["status"] != "ok")] gives A03 (offline) and B02 (warning).
What is the difference between df.loc[2] and df.iloc[2]?
Show answer
loc selects the row whose index label is 2; iloc selects the third row by position. They differ whenever the index is not 0, 1, 2…, for example after filtering or sorting.
Write a groupby that gives, for each status, the number of racks and the mean inlet temperature.
Show answer
df.groupby("status").agg(racks=("rack", "count"), mean_inlet=("inlet_c", "mean")).
Compute the mean inlet temperature of the rack table by hand (8 racks).
Show answer
Sum = 23.1 + 24.0 + 23.7 + 26.8 + 27.4 + 21.9 + 22.5 + 28.9 = 198.3; mean = 24.79 °C.
A left join of 1000 sensor readings to a table of 40 sensors gives 1000 rows, but 35 rows have NaN in the sensor location. What does that tell you, and what should you do?
Show answer
35 readings come from sensor IDs missing from the sensor table. Investigate (new sensors, typos, decommissioned devices) and fix or document them before analyzing by location.
A Series of minute-by-minute temperatures needs hourly averages and a 3-hour moving average of those. Write the code.
Show answer
hourly = s.resample("h").mean(); smooth = hourly.rolling(3).mean().
A table has columns site, jan, feb, mar with monthly energy. How do you make it tidy?
Show answer
df.melt(id_vars="site", var_name="month", value_name="energy_kwh"), giving one row per site and month.
Readings [10, NaN, 14] are interpolated linearly. What value replaces NaN?
Show answer
12, halfway between its neighbors.
Why is df["power_w"] = df["power_kw"] * 1000 preferred to looping over rows with iterrows?
Show answer
The vectorized expression runs in compiled code on the whole column and is much faster and clearer; iterrows processes rows one at a time in Python.
Lesson quiz · 5 questions
Score 60% or more to complete this lesson.
Create a free account to save your progress, take quizzes and earn a certificate.