
SLS-298 · Lesson 12 of 12 · 24 min
Season results and portfolio
▶ Video coming soon A video version of this lesson is on the way.
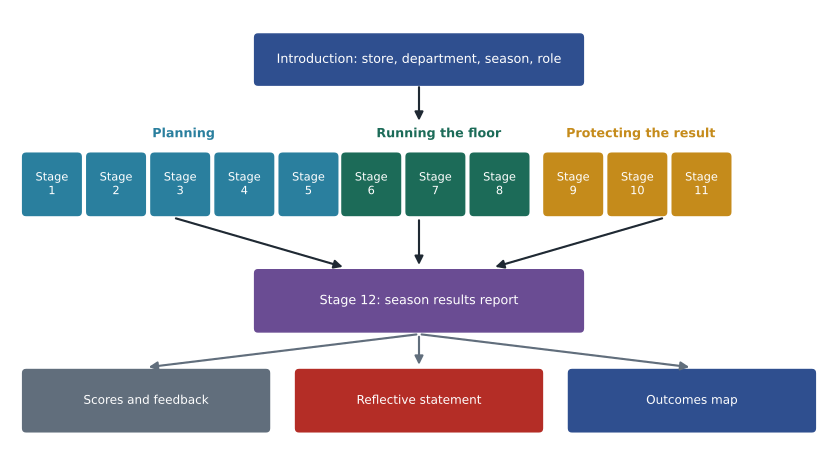
The spring 2027 season ended on Saturday, July 31, with the department's second full count that night. The final brief, dated Monday, August 9, 2027, contains the season's results, the count, the seller results for May to July, the survey and complaint data and Bev's scores for every earlier deliverable. Stage 12 has two deliverables. The first is the season results report: what the department achieved against the plan, why, and what the fall 2027 plan should carry forward. The second is the capstone portfolio: the twelve deliverables of the simulation, organised to show what the learner can do, with a reflective statement.
This lesson is where the simulation closes. Every number in it comes from the stages before, and every judgement in it should be one the learner could defend to Bev, to the owners, or to an employer reading the portfolio a year from now.
The season scorecard
| Goal | Plan | Actual | Result |
|---|---|---|---|
| Sales | 1,850,000 dollars | 1,859,000 dollars | Met, plus 0.5 in 100 |
| Transactions | 1,040 | 1,033 | Slightly below |
| Average sale | 1,780 dollars | 1,800 dollars | Met |
| Gross margin | 851,000 dollars (46.0 in 100) | 848,800 dollars (45.7 in 100) | Missed by 2,200 dollars |
| Markdowns | 148,000 dollars (8.0 in 100) | 146,700 dollars (7.9 in 100) | Met |
| Shrink | 0.8 in 100 | 1.1 in 100 for the season; 0.8 from May to July | Missed for the season |
| Protection-plan attachment | 28 in 100 | 27.5 in 100 | Narrowly missed |
| Plan cancellations within 30 days | 5 in 100 or less | 4.2 in 100 | Met |
| Satisfaction, 4 or 5 out of 5 | 90 in 100 | 89.7 in 100 for the season; 91 from May to July | Narrowly missed |
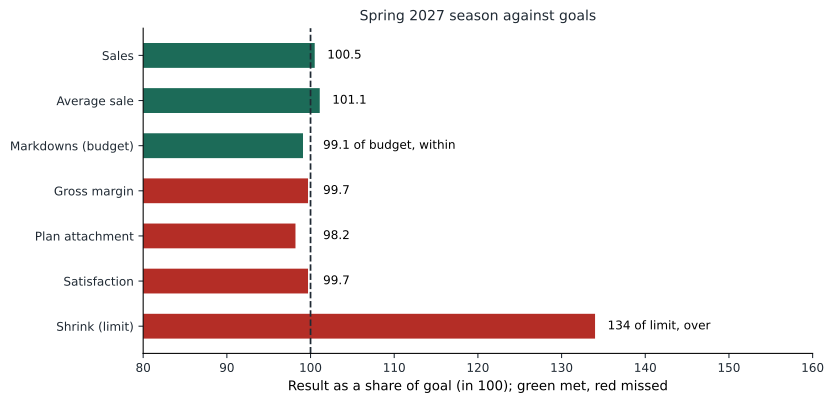
The season reforecast in stage 11 was 1,861,000 dollars, with a range of 1,840,000 to 1,880,000. Actual sales of 1,859,000 were within 2,000 dollars of the forecast. May to July came in at 948,000 dollars, 2,000 below the reforecast and 12,000 below the original plan for those months.
Worked problem
Checking the season figures
Sales were 911,000 dollars to April 30 and 948,000 dollars from May to July, on 506 and 527 transactions. Gross margin was 411,772 dollars to April 30 and 46.1 in 100 from May to July. What were season sales, the average sale and the gross margin rate?
Show solution
- Season sales:
- \[911{,}000 + 948{,}000 = 1{,}859{,}000 \text{ dollars}\]
- Average sale:
- \[\frac{1{,}859{,}000}{506 + 527} = \frac{1{,}859{,}000}{1{,}033} \approx 1{,}800 \text{ dollars}\]
- May to July margin:
- \[948{,}000 \times 0.461 = 437{,}028 \text{ dollars}\]
- Season margin and rate:
- \[411{,}772 + 437{,}028 = 848{,}800; \quad \frac{848{,}800}{1{,}859{,}000} \approx 0.457\]
Answer: Season sales were 1,859,000 dollars at an average of about 1,800 dollars per transaction, and gross margin was 848,800 dollars, about 45.7 in 100. The May to July margin rate of 46.1 was close to the 46.2 needed, but not quite enough to recover the first half.
Why margin missed
Gross margin missed by 2,200 dollars, a small amount on a season of almost 1.9 million. The report still has to say why, because the reason tells the fall plan what to fix.
Worked problem
The cost of excess shrink
Season shrink was 19,900 dollars. What would shrink have been at the 0.8 in 100 goal, and what would margin have been without the excess?
Show solution
- Shrink at the goal:
- \[1{,}859{,}000 \times 0.008 = 14{,}872 \text{ dollars}\]
- Excess shrink:
- \[19{,}900 - 14{,}872 = 5{,}028 \text{ dollars}\]
- Margin without the excess:
- \[848{,}800 + 5{,}028 = 853{,}828 \text{ dollars}\]
Answer: Without the excess shrink, margin would have been about 853,800 dollars, 2,800 above plan. The margin miss is almost entirely the shrink found in May. From May to July, shrink was 7,300 dollars on 948,000 of sales, about 0.77 in 100, which shows that the actions from stage 9 worked.
Markdowns, which had been 8,600 dollars over the plan at midseason, finished 1,300 dollars under the season budget because the department kept May to July markdowns to 66,900, inside the 68,200 that remained. The July clearance was planned inside that figure rather than added to it.
Productivity
Stage 2 measured the department's productivity with sales per square foot, turn and GMROI. The same measures close the season.
Worked problem
Season productivity
The department has 9,000 square feet. Average inventory at cost over the season was 805,000 dollars. What were sales per square foot and GMROI for the season, and how do they compare with 2025's 400 dollars per square foot and GMROI of 2.12 for the full year?
Show solution
- Sales per square foot for the season:
- \[\frac{1{,}859{,}000}{9{,}000} \approx 206.6 \text{ dollars}\]
- GMROI for the season:
- \[\frac{848{,}800}{805{,}000} \approx 1.05\]
- Approximate annual equivalents:
- \[206.6 \times 2 \approx 413; \quad 1.05 \times 2 \approx 2.11\]
Answer: Sales per square foot ran at the equivalent of about 413 dollars a year, above 2025's 400. GMROI was about flat, at the equivalent of 2.11 against 2.12, because inventory rose a little with the grey sectional reorder. Doubling a spring season is a rough annual measure, since fall sales are seasonally different, so Aiden labelled these as equivalents, not forecasts.
People results
The coaching plans from stage 7 had dates and measures, and the final report closes them.
| Seller | Goal set in stage 7 | Result |
|---|---|---|
| Leon | Average sale of 1,550 dollars by May 31 | 1,580 dollars for April 21 to May 31; custom orders became a regular part of his sales |
| Jasmine | Protection-plan attachment closer to the team target | 24 in 100 from May to July, up from 16 |
| Dylan | Conduct and conversion plan from April 6 | No further conduct concerns; conversion 11.8 in 100 from May to July, up from 9.2 but still below the team; plan continues into fall |
Dylan's result is the honest kind of result a report should include. He improved, but not enough, and the report says so without blame and with a next step. A report in which every person succeeds is usually a report that has left something out.
The tests, closed
| Test | Rule | Season result | Carry forward? |
|---|---|---|---|
| 999 sofa line | At least 18 of 120 new sales | 117 of 120 sold; 27 buyers recorded as competitor shoppers | Yes; repeat in fall |
| Feature display | Feature beats control | Feature kept all season; grey sectional reordered from it | Yes |
| Terracotta colour | 4 of 6 by mid-April | Needed a discount; moved to special order, 4 orders since | Special order only |
| 30-day check-in calls | Catch problems; find related sales | Continued all season; 9 early problems fixed | Yes; extend to other departments |
| Delivery reconfirmation | Timing complaints 4 a month or fewer | 3, 4 and 2 complaints in May, June and July | Yes |
The May to July survey gave a net promoter score of about 53, from 142 promoters, 61 passives and 22 detractors out of 225 responses, against the stage 10 target of 52. Timing complaints fell from about seven a month to three.
Recommendations for fall 2027
A season report ends with what the next plan should do differently. Aiden kept his list to three, each based on the evidence above.
| Recommendation | Evidence | Expected effect |
|---|---|---|
| Build the stage 9 shrink routine (damage entry before clearance, returns received by end of shift, weekly cycle count) into the fall plan from day one | Shrink fell from 1.4 to 0.8 in 100 once the routine started | Avoid about 5,000 dollars of excess shrink |
| Make the lead-time script and two reconfirmation calls part of every special order | Timing complaints fell by more than half; satisfaction reached 91 in 100 from May to July | Satisfaction at or above 90 for the full season |
| Keep attachment and cancellations as a pair in every report | Attachment rose from 22 to 27.5 in 100 while cancellations stayed at 4.2 | Attachment of 28 without pressure selling |
Template: the season results report
| Section | What to include |
|---|---|
| Summary | Three or four sentences: the result, the main reason, the main recommendation |
| Scorecard | Every goal with plan, actual and result |
| Analysis | The largest variances, with the cause behind each |
| Productivity | Sales per square foot, turn or GMROI, compared fairly |
| People | Coaching goals closed, honestly |
| Tests | Each test closed against its rule |
| Recommendations | Three, each with evidence and expected effect |
The capstone portfolio
The portfolio collects the twelve deliverables of the season into one document that shows what the learner can do. It is organised for a reader who did not see the season, such as an employer or a future manager, and it shows the learner's judgement as well as their arithmetic.
| Part | Contents |
|---|---|
| 1. Introduction | The store, the department and the season in one page; the learner's role |
| 2. Deliverables | The twelve stage deliverables in order, each with a one-paragraph note on the decision it supported |
| 3. Scores and feedback | Bev's rubric scores for each stage and what was changed in response |
| 4. Season results | The season results report |
| 5. Reflective statement | About 600 to 800 words on what the learner did well, what they would do differently and what they will carry into their next role |
| 6. Outcomes map | A table linking each course outcome to the deliverables that show it |
Worked problem
Aiden's scores across the season
Bev's scores for stages 1 to 11 were 17, 18, 18, 17, 18, 17, 19, 19, 18, 18 and 19, each out of 20. The season report scored 18. What is Aiden's total, and what share of the available marks is it?
Show solution
- Stages 1 to 11:
- \[17 + 18 + 18 + 17 + 18 + 17 + 19 + 19 + 18 + 18 + 19 = 198\]
- With the season report:
- \[198 + 18 = 216\]
- Share of 240:
- \[\frac{216}{240} = 0.90\]
Answer: Aiden scored 216 out of 240, or 90 in 100. More useful than the total is the pattern: his scores rose from 17 in the first stages to 19 in the later ones, and the points he lost were most often for missing measures of success or missing details on compliance, which his later work corrected.
Writing the reflective statement
A reflective statement is not a summary of the season; the deliverables already show that. It answers three questions in the learner's own voice: what did I do well, and what is the evidence; what would I do differently, and why; and what will I take into my next role. A good statement is specific. "I learned the importance of communication" says nothing. "I learned that sellers quote the best-case lead time to close a sale, and that a written lead time and two reconfirmation calls cut timing complaints by more than half" says what the writer learned and shows that it worked.
Aiden's statement began with the moment he found that six of eight lead-time complaints came from sellers quoting five weeks, including two of his own sales. He wrote that he had been doing the same thing he coached others out of, and that the fix began with him. That honesty is what an employer reading a portfolio looks for.
Privacy in the portfolio
A portfolio built from real work must not expose customers or colleagues. Before Aiden used his deliverables outside the store, he removed customer names and contact details, referred to sellers by role where the content concerned performance or conduct, and asked Bev to confirm which store figures he could show. The conduct conversation with Dylan from stage 7 appears in the portfolio only as a description of the approach, not as a record. The store's privacy obligations under PIPEDA and its duty to employees continue after the season ends.
Bev's final scoring
Bev scored the season report 18 out of 20. She gave full marks for the scorecard, the analysis of the margin miss and the recommendations. She took one point from productivity, because the report compared inventory without saying that the grey sectional reorder was a deliberate choice, and one from the people section, because Mei's results were left out. Her note on the portfolio was short: it showed a lead who could plan, run the floor and protect the result, and who told the truth when the numbers were not good. On Monday, August 16, the owners confirmed Aiden as upholstery department lead.
| Criterion | Excellent (4) | Developing (2) | Aiden |
|---|---|---|---|
| Scorecard | Every goal shown with result | Selected goals only | 4 |
| Analysis | Variances explained by cause, with working | Results listed without causes | 4 |
| Productivity and people | Fair comparisons; every coaching goal closed | Missing or unfair comparisons | 2 |
| Recommendations | Three, evidence-based, with expected effect | A wish list | 4 |
| Communication | Clear summary; privacy respected | Hard to follow; personal details exposed | 4 |
Reflection
Look back at your own deliverables for the twelve stages. Where did your scores rise, and what changed in your work? Which decision in the season would you make differently now, and what evidence persuades you? What will you say in an interview about the stage where the numbers were worst?
Common mistakes
MistakeLeading the season report with the best number and burying the misses.
InsteadShow every goal and explain the largest misses by cause.
MistakeComparing a half-season with a full year without saying so.
InsteadLabel equivalents and explain seasonal differences.
MistakeReporting that every coaching plan succeeded.
InsteadClose each plan honestly, with a next step where needed.
MistakeWriting a reflective statement in general terms.
InsteadName specific situations, evidence and changes.
MistakePutting customer or colleague details in a portfolio.
InsteadRemove identifying details and confirm what can be shown.
Summary and key terms
- Season sales were 1,859,000 dollars against 1,850,000, within 2,000 of the midseason forecast.
- Gross margin missed by 2,200 dollars; excess shrink of about 5,000 dollars explains the miss, and the shrink routine fixed it from May.
- Markdowns finished 1,300 dollars under budget; attachment reached 27.5 in 100 with cancellations at 4.2.
- A season report ends with three evidence-based recommendations for the next plan.
- The portfolio organises the twelve deliverables for a new reader, with scores, a reflective statement and an outcomes map, and protects privacy.
- Season results report
- A report comparing a season's results with its plan, explaining the causes and recommending changes.
- Capstone portfolio
- A collection of a learner's deliverables organised to show their abilities.
- Reflective statement
- A personal account of what the learner did well, would change and will carry forward.
- Outcomes map
- A table linking course outcomes to the evidence that shows them.
- Annual equivalent
- A part-year measure scaled to a year for comparison, labelled as such.
Practice problems
Work each problem on paper first, then reveal the answer to check.
Margin was 520,000 dollars against a plan of 525,000, and excess shrink was 6,000 dollars. What would margin have been without the excess?
Show answer
526,000 dollars, 1,000 above plan.
A department sold 600,000 dollars in six months on 3,000 square feet. What is the annual equivalent sales per square foot?
Show answer
600,000 ÷ 3,000 = 200 for six months, about 400 a year.
Rewrite "I learned a lot about teamwork" as a specific reflective sentence.
Show answer
For example: "When I drafted the Saturday schedule, I asked a senior seller to check it against the traffic counts, and moving one shift by two hours covered the afternoon peak without adding hours."
Lesson quiz · 5 questions
Score 60% or more to complete this lesson.
Create a free account to save your progress, take quizzes and earn a certificate.