
SLS-214 · Lesson 9 of 12 · 24 min
Territory and account data
▶ Video coming soon A video version of this lesson is on the way.
On November 6, Grace brought a different kind of report: a list of every account in Maya's territory, with a column for each thing Ridgeline knew about it. "So far we've looked at deals," she said. "Deals come from accounts. If you want to know where your next year of deals will come from, you have to analyze the territory, not just the pipeline."
A territory is the set of accounts, usually defined by geography, industry or size, that a seller is responsible for. SLS-210 described how Maya's territory was assigned in September: health care clinics, professional services firms and education in the south and east of Regina, plus towns within about 100 km. This lesson uses territory and account data to size the opportunity, set priorities and judge whether a quota is fair.
What account data is available
Ridgeline's CRM held several kinds of information about each account, of very different quality.
| Data | Source | Reliability |
|---|---|---|
| Name, address, industry | Purchased company data, cleaned in October | Good after the clean-up described in SLS-140 |
| Number of employees | Purchased data and sellers' notes | Approximate; often out of date |
| Current customer and products owned | Ridgeline's own billing records | Very good |
| Lease end dates for competitors' equipment | Sellers' notes from conversations | Patchy but valuable |
| Tier (A, B or C) | Grace's scoring against the ideal customer profile | Only as good as the inputs |
| Activity history | Logged calls, emails and meetings | Good for recent years |
The most valuable field was also the least complete: when a prospect's current lease ended. SLS-210 identified a lease ending within twelve months as the strongest trigger in Ridgeline's ideal customer profile. Grace encouraged every seller to ask about it in every first conversation and record the answer, because over time it turned guesswork into a calendar.
Sizing the territory
Grace started with counts. Maya's territory contained 640 accounts, of which 212 had 20 or more employees. Ridgeline already served 148 of them.
Worked problem
Penetration
Maya's territory has 640 accounts, and 148 are current Ridgeline customers. What share of the territory has Ridgeline penetrated?
Show solution
- \[\frac{148}{640} \approx 0.231\]
Answer: About 23.1 in 100 of accounts in the territory are customers. The other 492 accounts are prospects.
Penetration is the share of accounts in a territory that are customers. It varied by segment, which told Grace where the easiest growth might be.
| Segment | Accounts | Customers | Penetration |
|---|---|---|---|
| Clinics and health care | 160 | 47 | 29.4 in 100 |
| Professional services | 290 | 58 | 20.0 in 100 |
| Education | 54 | 21 | 38.9 in 100 |
| Other offices | 136 | 22 | 16.2 in 100 |
| Total | 640 | 148 | 23.1 in 100 |
Professional services was the largest segment by count and only 20 in 100 penetrated, so it held the most prospects: 232. Education was well penetrated, which meant growth there would come mostly from selling more to existing customers. Grace cautioned that low penetration is not automatically opportunity: it can mean the segment does not need what Ridgeline sells, or that a strong competitor dominates it. Win rates and loss reasons by segment, from lesson 5, help tell the difference.
White space
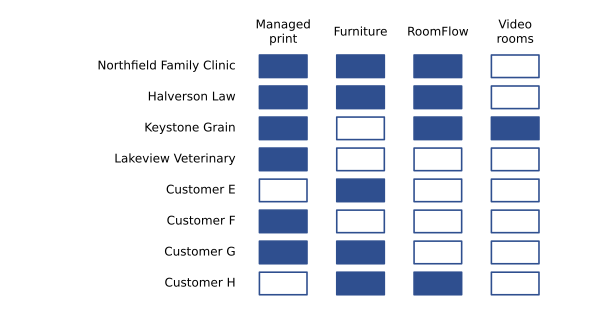
Existing customers are often the easiest source of new revenue. White space is the set of products a customer could buy but does not. Ridgeline had four product lines: managed print, furniture, RoomFlow and video meeting rooms.
Worked problem
White space in the territory
Maya's 148 customers own 231 product lines between them, out of the four Ridgeline sells. How many product lines does the average customer own, and how many customer-product combinations are white space?
Show solution
- Average product lines per customer.
- \[\frac{231}{148} \approx 1.56\]
- Possible combinations if every customer owned all four.
- \[148 \times 4 = 592\]
- White space.
- \[592 - 231 = 361\]
Answer: The average customer owns about 1.56 of Ridgeline's four product lines, and there are 361 customer-product combinations not yet sold.
Not every gap is a real opportunity. A small accounting firm with one meeting room may never need a video room. But a white space table, with customers in rows and product lines in columns, shows quickly which customers own only one product, and which products are rarely sold together when they should be. Northfield's expansion and Halverson Law's second-floor printer, from lesson 8, both came from exactly this kind of review.
Tiering accounts
A seller cannot give every account the same attention. Tiering sorts accounts into groups that get different levels of effort. Grace scored every account against Ridgeline's ideal customer profile from SLS-210 and assigned three tiers.
| Tier | Accounts | Description | Coverage plan |
|---|---|---|---|
| A | 63 | Strong fit: 20 to 250 employees, several meeting rooms, regulated records or a lease ending soon | Personal contact at least quarterly; account plan |
| B | 149 | Good fit on some criteria | Personal contact twice a year; nurture emails |
| C | 428 | Small or weak fit | Marketing emails and inbound response only |
Tiers turn into a workload. Sixty-three tier A accounts contacted four times a year is 252 contacts; 149 tier B accounts twice a year is 298 more, for 550 planned personal contacts a year. At about four meetings or substantial calls a day on roughly 200 selling days, Maya had capacity for about 800 a year, so the plan fit with room for new opportunities and customers. If it had not fit, the answer would have been to move accounts from tier B to marketing coverage, or to ask for help from the inside team.
Estimating potential
To judge whether a quota is reasonable, Grace estimated the market potential of the territory: how much Ridgeline could sell there in a year if it won every realistic opportunity. She used a simple tier-based estimate.
Worked problem
Potential and the quota-to-potential ratio
Grace estimates average annual first-year potential of 18,000 dollars for a tier A account, 7,500 dollars for tier B and 1,800 dollars for tier C. Maya's territory has 63, 149 and 428 accounts in the three tiers. Estimate the territory's potential and compare it with Maya's 600,000-dollar annual quota.
Show solution
- Potential by tier.
- \[63 \times 18{,}000 = 1{,}134{,}000\]
- \[149 \times 7{,}500 = 1{,}117{,}500\]
- \[428 \times 1{,}800 = 770{,}400\]
- Total.
- \[1{,}134{,}000 + 1{,}117{,}500 + 770{,}400 = 3{,}021{,}900\]
- Quota as a share of potential.
- \[\frac{600{,}000}{3{,}021{,}900} \approx 0.199\]
Answer: The territory's estimated potential is about 3,021,900 dollars a year, so Maya's quota asks her to capture about 19.9 in 100 of it.
The quota-to-potential ratio is a good fairness check. Kevin Moreau's territory, which included several large manufacturers and a hospital, had an estimated potential of about 3,900,000 dollars against the same 600,000-dollar quota, a ratio of about 15.4 in 100. Kevin needed to capture a smaller share of his market than Maya did. Grace raised this with Rob as an input for 2027 quotas: either Maya's quota should come down slightly, or the territories should be rebalanced.
Potential estimates are rough. The averages per tier came from Ridgeline's billing history for similar customers, which favours the kinds of customer Ridgeline already wins. They also assume that accounts buy every year, when in practice a managed print customer might sign once every five years. Grace treated potential as a way to compare territories, not as a forecast.
Timing: where next year's deals will come from
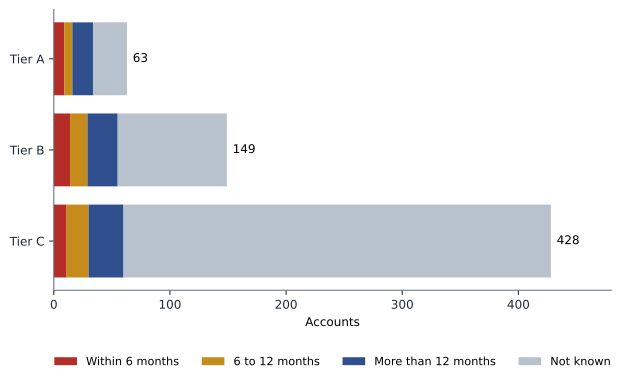
The best territory analysis looks forward. Combining lease end dates with tiers gave Maya a calendar of when each account was likely to be ready to talk.
| Lease end recorded | Tier A | Tier B | Tier C |
|---|---|---|---|
| Within 6 months | 9 | 14 | 11 |
| 6 to 12 months | 7 | 15 | 19 |
| More than 12 months | 18 | 26 | 30 |
| Not known | 29 | 94 | 368 |
Sixteen tier A accounts had leases ending within a year: 9 within six months and 7 more within twelve. Some were Ridgeline customers coming up for renewal, which the renewal pipeline from SLS-140 handles; the rest were prospects leasing from competitors, and those were Maya's highest priorities for the first quarter of 2027. The 29 tier A accounts with no known lease date were the next priority, because finding out the date was itself valuable. This is how the territory analysis fed the prospecting plan in SLS-210.
Using territory data well
Territory analysis fails in predictable ways. Purchased data goes stale; a firm listed with 40 employees may have 15. Tiers become self-fulfilling: accounts in tier C never get contacted, so they never become customers, which seems to confirm the tier. And sellers sometimes treat the territory list as complete, when new businesses open every month. Grace refreshed tiers twice a year, moved a sample of tier C accounts up for testing, and asked sellers to add new businesses they saw as they drove their territories.
Privacy rules also apply to account data. Business contact information is covered by different rules in different places, and SLS-140 and SLS-150 explained what Ridgeline may collect and how long it may keep it. Territory analysis works mostly at the account level, which reduces the amount of personal information involved.
Territory design across the team
Territory analysis is not only for individual sellers. When Rob and Grace planned fiscal 2027, they looked at all six field territories side by side: number of accounts, potential, current customers, travel time and the number of tier A accounts. Good territory design balances two things that pull against each other: equal opportunity, so that quotas can be fair, and reasonable workload, so that each seller can cover the accounts that matter.
Changing territories has costs. Customers value continuity, and a seller who loses an account she has nurtured for a year may lose motivation along with commission. Ridgeline's practice was to change territories only once a year, at the start of the fiscal year, to protect accounts with open opportunities by leaving them with their current seller until those deals closed, and to explain every change with the data behind it.
Worked problem
Comparing two territories
Territory 1 has 640 accounts and estimated potential of 3,021,900 dollars; territory 2 has 520 accounts and potential of 3,900,000 dollars. Both carry a 600,000-dollar quota. Calculate potential per account and the quota-to-potential ratio for each.
Show solution
- Territory 1.
- \[\frac{3{,}021{,}900}{640} \approx 4{,}722 \text{ dollars per account}\]
- \[\frac{600{,}000}{3{,}021{,}900} \approx 0.199\]
- Territory 2.
- \[\frac{3{,}900{,}000}{520} = 7{,}500 \text{ dollars per account}\]
- \[\frac{600{,}000}{3{,}900{,}000} \approx 0.154\]
Answer: Territory 2 has more potential per account and needs a smaller share of its potential to reach quota: about 15.4 in 100 against about 19.9. Territory 1 asks more of its seller for the same quota.
Maya used the territory analysis to rewrite her weekly routine. Monday mornings went to tier A accounts with leases ending within a year; Tuesday and Wednesday afternoons to discovery calls and site visits; Thursday mornings to calls on tier B accounts whose lease dates were unknown, with the single aim of finding out the date; and Friday mornings to Grace's session and her own dashboard. The routine turned a list of 640 names into a plan she could follow week by week, and each part of it could be checked against a measure on her dashboard.
Grace added that potential should be revisited whenever the territory changed materially. A new hospital clinic opening, a large firm moving its head office into the territory, or a school division merging two schools would all shift potential, and a quota set on last year's map could quickly become unfair in either direction.
Finally, territory data should be shared with the people who support the seller. Ridgeline's inside team used Maya's tiers to decide which inbound leads to pass to her immediately and which to nurture, and marketing used the lease calendar to time its mailings. A territory plan that only the seller can see does less than half its job.
Common mistakes
MistakeTreating low penetration as automatic opportunity.
InsteadCheck win rates and loss reasons in the segment first.
MistakeIgnoring existing customers.
InsteadMap white space; selling more to customers is often the easiest growth.
MistakeGiving every account the same attention.
InsteadTier accounts and plan coverage by tier, then check the workload fits.
MistakeComparing quotas without comparing territories.
InsteadUse the quota-to-potential ratio to check fairness.
MistakeLetting tiers and data go stale.
InsteadRefresh tiers regularly, test a sample of low-tier accounts and add new businesses.
Summary and key terms
- A territory is the set of accounts a seller covers.
- Ridgeline had penetrated about 23.1 in 100 of Maya's 640 accounts, with penetration ranging from about 16 in 100 in other offices to about 39 in education.
- White space counts unsold customer-product combinations: 361 in her territory, with customers owning about 1.56 of four product lines.
- Tiering sorts accounts by fit and sets coverage; Maya's plan needed about 550 personal contacts a year against capacity of about 800.
- A tier-based estimate put the territory's potential at about 3,021,900 dollars, so her quota was about 19.9 in 100 of potential, against about 15.4 for Kevin.
- Lease end dates turn the territory into a calendar of likely deals.
- Territory
- The set of accounts a seller is responsible for.
- Penetration
- The share of accounts in a territory or segment that are customers.
- White space
- Products a customer could buy but does not yet own.
- Tiering
- Sorting accounts into groups that get different levels of sales effort.
- Market potential
- An estimate of how much could be sold in a territory if every realistic opportunity were won.
- Quota-to-potential ratio
- Quota divided by estimated potential; a check on whether quotas are fair across territories.
Practice problems
Work each problem on paper first, then reveal the answer to check.
A territory has 400 accounts and 72 customers. What is the penetration?
Show answer
72 ÷ 400 = 0.18, or 18 in 100.
Fifty customers could each buy three product lines and own 80 between them. How much white space is there?
Show answer
50 × 3 − 80 = 70 customer-product combinations.
A quota of 500,000 dollars sits in a territory with potential of 2,500,000. What is the quota-to-potential ratio?
Show answer
500,000 ÷ 2,500,000 = 0.20, or 20 in 100.
Lesson quiz · 5 questions
Score 60% or more to complete this lesson.
Create a free account to save your progress, take quizzes and earn a certificate.