
SLS-214 · Lesson 2 of 12 · 20 min
Activity, pipeline and outcome metrics
▶ Video coming soon A video version of this lesson is on the way.
At the second Friday session, on September 25, Grace asked Maya to bring her CRM activity report for her first four weeks. Maya had made 162 calls, sent about 190 emails, held 14 first meetings and won one deal, the Northfield Family Clinic managed print agreement that Dr. Anand would sign in early October. "Is that good?" Maya asked. Grace's answer was the theme of this lesson: "It depends which layer you look at, and what each number leads to."
Lesson 1 introduced the three layers of sales measures: activity, pipeline and outcome. This lesson defines the main measures in each layer, shows how they connect, and introduces pipeline coverage, the measure Grace said she would look at first if she could look at only one.
The activity layer
Activity measures count what sellers do. They are the easiest to collect, because the CRM and the phone and email systems record most of them automatically, and they are the measures a seller controls most directly.
| Activity measure | What it counts | Watch out for |
|---|---|---|
| Dials or calls | Outbound phone calls attempted | Counts effort, not conversations |
| Connects | Calls where the seller reached the right person | Depends on list quality and time of day |
| Emails sent | Individual or sequence emails | Volume says nothing about relevance |
| First meetings held | First real conversations with a prospect, in person or by video | Booked is not the same as held |
| Second meetings and site visits | Follow-up meetings that deepen discovery | Shows engagement beyond curiosity |
| Demos and presentations | Showing a solution to a buying group | Should follow discovery, not replace it |
| Proposals sent | Written proposals or quotes | Often recorded as a pipeline stage too |
Activity measures are useful mainly as ratios between steps. A seller's dials matter only because some become connects, some connects become meetings, and so on. Grace calculated Maya's ratios for her first eleven weeks, from August 31 to November 13.
Worked problem
Maya's activity ratios
From August 31 to November 13, 2026, Maya made 412 calls and reached the right person on 96 of them. She held 41 first meetings, which produced 17 qualified opportunities. She sent 12 proposals and won 4 deals. Calculate the connect rate, the share of connects that became first meetings, and the share of first meetings that became qualified opportunities.
Show solution
- Connect rate is connects divided by calls.
- \[\frac{96}{412} = 0.233 \approx 23 \text{ in } 100\]
- Meetings per connect is first meetings divided by connects. Some meetings came from referrals and inbound leads, so this ratio slightly overstates what calls alone produced.
- \[\frac{41}{96} = 0.427 \approx 43 \text{ in } 100\]
- Qualified opportunities per first meeting.
- \[\frac{17}{41} = 0.415 \approx 41 \text{ in } 100\]
Answer: About 23 in 100 calls connected, about 43 meetings came for every 100 connects, and about 41 in 100 first meetings became qualified opportunities, close to the 40 in 100 Darnell used in Maya's territory plan.
The last ratio mattered most to Darnell, because it showed that Maya was choosing prospects well: four in ten first meetings were worth pursuing. If that ratio had been one in ten, the fix would have been in targeting, not effort.
The pipeline layer
The pipeline is the set of open opportunities a seller or team is working. Each opportunity in the CRM has a stage, an amount and an expected close date, as SLS-140 described. Pipeline measures summarize those records.
| Pipeline measure | Definition | Why it matters |
|---|---|---|
| Open opportunities | Count of opportunities not yet won or lost | Shows how many live deals a seller is managing |
| Pipeline value | Sum of amounts of open opportunities | The raw size of future business |
| Pipeline by stage | Count and value at each stage | Shows whether deals are moving or piling up |
| Weighted pipeline | Each amount times its stage probability, summed | A first forecast (lesson 7) |
| Pipeline coverage | Pipeline expected to close in a period divided by the quota for that period | Shows whether there is enough business to reach the target |
| Aging and slippage | How long deals have been open; deals past their close date | Flags stale or unrealistic opportunities |
| New pipeline created | Value of opportunities added in a period | A leading indicator of future quarters |
Ridgeline's CRM stores two amounts for each opportunity, a detail that caught Maya out. The amount field holds the total contract value: a five-year managed print agreement at 412 dollars a month has an amount of 24,720 dollars. Quotas, however, are set on first-year revenue: what the customer will pay in the first twelve months. For the same agreement that is 4,944 dollars. One-time purchases such as furniture have the same value in both fields. Grace's rule: compare pipeline with quota using first-year value, and compare it with the company's revenue plan using total value. Mixing them makes coverage look three or four times better than it is.
Pipeline coverage
Pipeline coverage asks a simple question: is there enough business in the pipeline, expected to close in the period, to reach the target? Because many opportunities will be lost, coverage needs to be well above one. A common rule of thumb is three times quota, which matches a win rate of about one in three. A team with a lower win rate needs more coverage; one with a higher win rate needs less.
The right coverage target follows from the win rate. If a team expects to win a fraction w of the value in its pipeline, it needs coverage of about 1 ÷ w. At a win rate of 25 in 100, that is 1 ÷ 0.25 = 4 times quota. Ridgeline used 3 times as its standard because its value-weighted win rate on deals expected in a quarter had historically been about one in three.
Worked problem
Maya's coverage for the next quarter
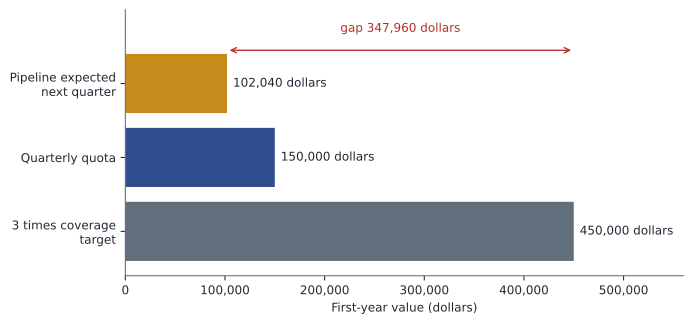
Maya's quota for the first quarter of fiscal 2027 (December 2026 to February 2027) is 150,000 dollars of first-year revenue. Five of her open opportunities are expected to close in that quarter, with first-year values of 9,200 (Westgate & Rowe), 4,800 (Eastgate Physiotherapy), 18,440 (Northfield's expansion), 48,000 (Keystone's training centre) and 21,600 dollars (Harvest Valley Credit Union). What is her coverage, and how much more first-year pipeline would she need for 3 times coverage?
Show solution
- Add the first-year values expected in the quarter.
- \[9{,}200 + 4{,}800 + 18{,}440 + 48{,}000 + 21{,}600 = 102{,}040 \text{ dollars}\]
- Divide by the quarterly quota.
- \[\frac{102{,}040}{150{,}000} = 0.68\]
- Three times coverage would need 3 × 150,000 = 450,000 dollars.
- \[450{,}000 - 102{,}040 = 347{,}960 \text{ dollars}\]
Answer: Coverage is about 0.68 times quota, far below the 3 times target. Maya needs about 348,000 dollars more first-year pipeline expected in the quarter, which is why her prospecting plan for the first quarter (SLS-210) calls for about 65 new first meetings.
The low number did not mean Maya was failing. New sellers almost always start with thin pipelines, because the deals they create in their first months take time to mature. It did mean that her prospecting in November and December mattered more than anything else she could do. Grace drew the distinction sharply: "A thin pipeline in November is a December problem you can still fix. A thin pipeline in February is a quarter you have already lost."
The outcome layer
Outcome measures record results: what was won, lost and booked. They are lagging indicators, but they are what the business finally cares about, and they are the basis for pay.
| Outcome measure | Definition |
|---|---|
| Bookings | Value of deals signed in a period, usually first-year revenue for quota purposes |
| Deals won and lost | Counts of opportunities closed as won and as lost |
| Win rate | Deals won divided by deals closed (lesson 5) |
| Average deal size | Bookings divided by number of deals won |
| Quota attainment | Bookings divided by quota (lesson 6) |
| Average discount | Average reduction from list price on won deals |
| Revenue and gross margin | What the customer actually pays over time, and what is left after the cost of delivering it |
Bookings and revenue are not the same. A deal booked in October may not produce revenue until the equipment is installed in January, and a five-year contract produces revenue for five years. Sales teams are usually measured on bookings, because that is what they control. Finance teams care about revenue. The difference explains why Rob and Ridgeline's controller sometimes quoted different numbers for the same month.
How the layers connect
The layers are linked by ratios. Enough of the right activity produces pipeline; enough pipeline, converted at a reasonable rate, produces bookings. Grace wrote the chain out for Maya's planning numbers from SLS-210: 400 first meetings lead to 160 qualified opportunities at 40 in 100, which lead to 40 wins at 25 in 100, which at an average first-year value of 15,000 dollars make the 600,000-dollar quota.
Read from right to left, the chain turns a quota into an activity plan. A 600,000-dollar annual quota at an average first-year value of 15,000 dollars means 40 wins. At a win rate of 25 in 100, 40 wins need 160 qualified opportunities. At 40 in 100 of first meetings becoming qualified, 160 opportunities need 400 first meetings, about 8 a week over 50 weeks. Darnell had pointed out in SLS-210 that referrals, inbound leads and expansions would supply about half of those, leaving Maya to generate about 4 or 5 a week herself.
Read from left to right, the chain shows where to look when results fall short. If bookings are low, is it because there were too few meetings, too few meetings became opportunities, too few opportunities were won, or the deals were small? Each answer points to a different fix. Lesson 12 uses exactly this reasoning on Ridgeline's third quarter.
Choosing a small set of measures
A CRM can produce hundreds of measures, and a seller who tries to watch them all watches none of them well. Grace recommended that each seller choose about five measures to review every week: one or two activity measures they want to improve, pipeline coverage for the next quarter, new pipeline created, and bookings against quota. Managers add measures across the team, such as conversion by stage and average discount.
Good measures share some features. They are clearly defined, so everyone calculates them the same way. They are available quickly, so they can guide action. They are connected to an outcome that matters. And they are hard to game, or are balanced by another measure that would show the gaming.
Activity quality, not just quantity
Counting activities invites the question Grace asked every new seller: "Which of these would you do again?" A call that reached the office manager of a tier A clinic and booked a site visit is worth far more than ten calls to numbers that ring out. Ridgeline therefore tracked a few quality measures alongside the counts: the share of first meetings held with accounts that matched the ideal customer profile, the share of meetings that ended with an agreed next step, and the share of proposals that followed a completed discovery.
Maya's quality numbers were encouraging. Of her 41 first meetings, 29 were with tier A or tier B accounts, about 71 in 100, and 33 ended with a next step in the diary, about 80 in 100. Darnell told her that he would rather see her hold four well-chosen meetings a week with clear next steps than eight with anyone who would take a call. Quality measures are harder to collect than counts, because a seller must record the next step or the tier must be known, but they are what make activity numbers meaningful.
Common mistakes
MistakeComparing total contract value in the pipeline with a first-year revenue quota.
InsteadCompare like with like: first-year pipeline with first-year quota.
MistakeCounting meetings booked instead of meetings held.
InsteadCount what actually happened; booked meetings that are cancelled produce nothing.
MistakeTreating pipeline value as a forecast.
InsteadPipeline value is the raw size; a forecast must account for how much will be lost (lessons 7 and 8).
MistakeUsing a 3 times coverage rule regardless of win rate.
InsteadSet the coverage target from the win rate: roughly 1 divided by the win rate.
MistakeConfusing bookings with revenue.
InsteadBookings are signed deals; revenue is what the customer pays over time.
Summary and key terms
- Activity measures count what sellers do and are most useful as ratios between steps.
- Maya connected on about 23 in 100 calls and turned about 41 in 100 first meetings into qualified opportunities.
- Pipeline measures summarize open opportunities: count, value, stage, age, slippage and new pipeline.
- Pipeline coverage is first-year pipeline expected to close in a period divided by quota; its target is roughly 1 divided by the win rate.
- Maya's coverage for the next quarter was about 0.68 times.
- Outcome measures record bookings, wins, losses, deal size and attainment; bookings are not revenue.
- The layers connect through ratios, so a quota can be turned into an activity plan, and a shortfall can be traced to its cause.
- Pipeline
- The set of open opportunities a seller or team is working.
- Pipeline coverage
- Pipeline expected to close in a period divided by the quota for that period.
- First-year revenue
- What a customer will pay in the first twelve months of a deal; Ridgeline's quota measure.
- Total contract value
- The full value of a contract over its whole term.
- Bookings
- The value of deals signed in a period.
- Connect rate
- The share of calls that reach the right person.
Practice problems
Work each problem on paper first, then reveal the answer to check.
A seller has 180,000 dollars of first-year pipeline expected next quarter and a quarterly quota of 120,000 dollars. What is the coverage?
Show answer
180,000 ÷ 120,000 = 1.5 times.
A team wins about 20 in 100 of the value in its pipeline. What coverage should it aim for?
Show answer
About 1 ÷ 0.20 = 5 times quota.
A five-year agreement costs 300 dollars a month. What are its total contract value and first-year revenue?
Show answer
Total: 300 × 60 = 18,000 dollars. First year: 300 × 12 = 3,600 dollars.
Lesson quiz · 5 questions
Score 60% or more to complete this lesson.
Create a free account to save your progress, take quizzes and earn a certificate.