
SLS-214 · Lesson 4 of 12 · 23 min
Sales velocity
▶ Video coming soon A video version of this lesson is on the way.
Rob Kowalski joined the Friday session on October 9. He had a problem he wanted explained in one number. "In the second quarter we booked 744,000 dollars. In the third we booked 591,000. Everyone has a theory about why. Can you tell me which part of the machine slowed down?" Grace said she could, and that the tool she would use was called sales velocity.
Lessons 2 and 3 measured the pipeline one piece at a time: how many opportunities, how big, how many convert. Sales velocity combines the main pieces into a single rate: how much revenue the pipeline is producing per day. It is useful because it shows how the pieces trade off against each other, and because a change in velocity can be traced back to the piece that caused it.
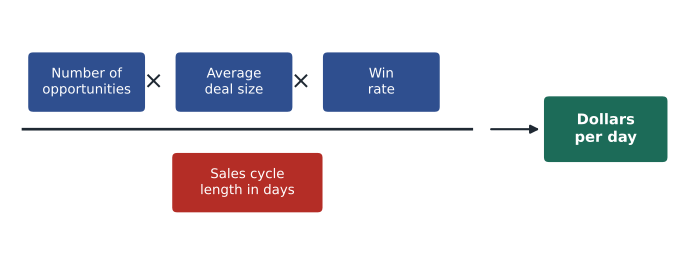
The formula
Sales velocity multiplies three things that make revenue larger and divides by the one thing that makes it slower.
The result is in dollars per day. Each term has a plain meaning.
| Term | Meaning | At Ridgeline |
|---|---|---|
| Number of opportunities | Qualified opportunities being worked in the period | Open opportunities past Qualify |
| Average deal size | Average value of a won deal | First-year revenue per won deal |
| Win rate | Share of closed opportunities that were won | Won divided by won plus lost (lesson 5) |
| Sales cycle length | Average days from opportunity creation to close | Median days from Qualify to Closed Won |
The logic is straightforward. Multiply the number of opportunities by the share that will be won to get the number of wins; multiply by the average deal size to get the revenue those wins will bring; divide by how many days the deals take to close to get revenue per day. The formula is a simplification, because it treats the pipeline as steady, but it captures the main trade-offs well.
Comparing two quarters
Worked problem
Velocity in the second and third quarters
In the second quarter (March to May 2026) the team worked 90 qualified opportunities, won deals averaging about 21,900 dollars of first-year value (744,000 dollars from 34 wins), had a win rate of 27 in 100 and a median cycle of 61 days. In the third quarter (June to August) the figures were 84 opportunities, 19,700 dollars (591,000 dollars from 30 wins), 24 in 100 and 70 days. Calculate the velocity for each quarter and the revenue each implies over a 92-day quarter.
Show solution
- Second quarter.
- \[\frac{90 \times 21{,}900 \times 0.27}{61} = \frac{532{,}170}{61} \approx 8{,}724 \text{ dollars per day}\]
- \[8{,}724 \times 92 \approx 803{,}000 \text{ dollars}\]
- Third quarter.
- \[\frac{84 \times 19{,}700 \times 0.24}{70} = \frac{397{,}152}{70} \approx 5{,}674 \text{ dollars per day}\]
- \[5{,}674 \times 92 \approx 522{,}000 \text{ dollars}\]
- Ratio of the two velocities.
- \[\frac{5{,}674}{8{,}724} \approx 0.65\]
Answer: Velocity fell from about 8,724 to 5,674 dollars a day, to about 65 in 100 of its earlier level. Over 92 days that implies about 803,000 and 522,000 dollars, against 744,000 and 591,000 actually booked.
The implied figures miss actual bookings by roughly a tenth, because velocity is a model and the real pipeline was not steady: some third-quarter wins came from deals that had been in the pipeline since spring, which softened the drop. The model exaggerates the change, but it points in the right direction and shows which terms moved, which is what Rob asked.
Which part slowed down?
Because velocity is a product and a quotient, the change from one quarter to the next can be split into the change in each term. Grace divided each third-quarter term by its second-quarter value.
| Term | Second quarter | Third quarter | Effect on velocity |
|---|---|---|---|
| Opportunities | 90 | 84 | 84 ÷ 90 = 0.93 |
| Average deal size | 21,900 | 19,700 | 19,700 ÷ 21,900 = 0.90 |
| Win rate | 27 in 100 | 24 in 100 | 0.24 ÷ 0.27 = 0.89 |
| Cycle length | 61 days | 70 days | 61 ÷ 70 = 0.87 |
| Combined | 0.93 × 0.90 × 0.89 × 0.87 ≈ 0.65 |
The answer to Rob's question was that all four terms moved the wrong way at once, and no single one explained the drop. The pipeline was about 7 in 100 smaller, won deals were about 10 in 100 smaller, win rate fell by about 11 in 100 of its earlier value, and cycles were about 15 in 100 longer, which cut velocity by about 13 in 100. Lesson 12 digs into why each of these happened. Rob's reaction was practical: "So there's no one thing to fix. Then I want to know which of the three is cheapest to fix."
The four levers
Velocity gives a seller or team four levers, and the formula shows that they are equal in power: a 10 in 100 improvement in any of the three multiplying terms raises velocity by 10 in 100.
Worked problem
Pulling one lever at a time
Starting from the third-quarter velocity of 5,673.60 dollars a day, calculate the velocity if the team improves each lever separately: 10 in 100 more opportunities, 10 in 100 larger deals, 10 in 100 higher win rate, or a cycle 10 in 100 shorter. Then calculate the effect of all four together.
Show solution
- More opportunities, larger deals or higher win rate: each multiplies velocity by 1.1.
- \[5{,}673.60 \times 1.1 = 6{,}240.96 \text{ dollars per day}\]
- A cycle 10 in 100 shorter is 70 × 0.9 = 63 days.
- \[\frac{397{,}152}{63} = 6{,}304 \text{ dollars per day}\]
- All four together.
- \[5{,}673.60 \times \frac{1.1 \times 1.1 \times 1.1}{0.9} \approx 5{,}673.60 \times 1.479 \approx 8{,}391 \text{ dollars per day}\]
Answer: Each multiplying lever adds about 567 dollars a day; shortening the cycle by 10 in 100 adds about 630, slightly more, because dividing by 0.9 raises velocity by about 11 in 100. Small improvements in all four together raise velocity by nearly half.
The last line is the most important. Teams often chase one lever hard, usually more opportunities, because it is the easiest to describe. Modest improvements across all four are usually more achievable than a large improvement in one, and they multiply.
| Lever | Typical ways to pull it | Typical side effects |
|---|---|---|
| More opportunities | More prospecting, better lead routing, referrals | Lower quality if targeting slips; more work for sellers |
| Larger deals | Selling complete solutions, multi-year terms, bundles | Longer cycles and more stakeholders |
| Higher win rate | Better discovery and qualification, stronger proposals | Fewer opportunities if qualification becomes too strict |
| Shorter cycle | Mutual action plans, earlier involvement of decision-makers, simpler contracts | Pressure tactics can damage trust if overused |
The side effects matter because the levers are not independent. Pushing for larger deals usually lengthens cycles; qualifying harder raises win rate but reduces the number of opportunities. A change that helps one term and hurts another may leave velocity unchanged. That is why Grace always recalculated the whole formula before recommending anything.
Velocity for one seller
Velocity also works for individual sellers, with care about small numbers.
Worked problem
Maya and Kevin
Maya has 7 open qualified opportunities with an average first-year value of 17,790 dollars and a cycle of about 66 days. She has closed only 10 opportunities so far, too few for a reliable win rate, so Grace uses the team's 24 in 100. Kevin Moreau has 22 open opportunities averaging 24,000 dollars, a win rate of 30 in 100 over the last year and a cycle of 58 days. Compare their velocities.
Show solution
- Maya.
- \[\frac{7 \times 17{,}790 \times 0.24}{66} \approx 453 \text{ dollars per day}\]
- Kevin.
- \[\frac{22 \times 24{,}000 \times 0.30}{58} \approx 2{,}731 \text{ dollars per day}\]
- Ratio.
- \[\frac{2{,}731}{453} \approx 6.0\]
Answer: Kevin's pipeline is producing about six times as much revenue per day as Maya's. Most of the gap is the number of opportunities, 22 against 7, which is normal for a seller ten weeks into a new territory.
The comparison was not meant to discourage Maya. It showed her that her most powerful lever for the next quarter was the number of opportunities, which she could change through prospecting. Her deal size and cycle were already close to the team's. Darnell's advice was to track her velocity monthly and to watch it rise as the deals she created in October and November matured.
Limits of the velocity model
Velocity is a useful lens, not a forecast. It assumes the pipeline is steady, so it works poorly when a few very large deals dominate, such as Prairie Valley's school division contract, or when the business is seasonal. It uses averages, which hide the mix of large and small deals. And its terms must be measured consistently: if the win rate counts deals by number but the average deal size is by value, the result can mislead. Grace used velocity to compare periods and to explain changes, and used the weighted pipeline and forecast categories of lessons 7 and 8 to predict actual bookings.
A spreadsheet makes velocity easy to keep current. Grace's team sheet had one row per quarter with the four inputs in columns B to E and the formula in column F: =B2*C2*D2/E2. Copying the formula down gave a velocity history, and a fifth column dividing each quarter by the one before showed the change at a glance. Lesson 10 covers formulas like these.
Velocity by segment and product
A team's single velocity number hides the fact that different kinds of business move at different speeds. Grace calculated velocity separately for Ridgeline's main deal types, using the same four terms for each. Managed print deals were numerous, of medium size, won fairly often and closed in about seven weeks. RoomFlow and video-room deals were fewer and larger but took nearly three months and were won less often. Furniture deals were small and quick.
The comparison helped Rob think about where to invest. A sales hour spent on managed print produced revenue sooner than an hour spent on a complex RoomFlow deal, but RoomFlow subscriptions renewed year after year, so their value did not show fully in first-year revenue. Velocity measured on first-year revenue therefore understated RoomFlow. Grace added a note to her velocity table explaining that it measured speed, not the long-term value of a customer, and that the two had to be weighed together.
Segment velocity also showed seasonality. School deals had high velocity in September and October and almost none in July. Comparing the team's summer velocity with its spring velocity without allowing for schools exaggerated the slowdown. Grace's practice was to compare each quarter with the same quarter a year earlier as well as with the quarter just before, which separates seasonal patterns from real change.
Worked problem
Velocity for two deal types
Managed print: 50 opportunities, average first-year deal 12,000 dollars, win rate 30 in 100, cycle 49 days. RoomFlow and video rooms: 20 opportunities, average 30,000 dollars, win rate 20 in 100, cycle 84 days. Compare their velocities.
Show solution
- Managed print.
- \[\frac{50 \times 12{,}000 \times 0.30}{49} \approx 3{,}673 \text{ dollars per day}\]
- RoomFlow and video rooms.
- \[\frac{20 \times 30{,}000 \times 0.20}{84} \approx 1{,}429 \text{ dollars per day}\]
Answer: Managed print produces about 3,673 dollars of first-year revenue a day and RoomFlow about 1,429. The comparison measures speed only; RoomFlow's renewals add value that first-year revenue does not capture.
Grace also warned against comparing velocities across companies or industries. A software company selling small subscriptions online might have a velocity measured in hundreds of thousands of dollars a day; an equipment dealer selling a few large machines a year might have a velocity of a few hundred. Neither number says whether the business is healthy. Velocity is most useful for comparing the same team with itself over time, or similar sellers within one company, where the terms are measured the same way.
Common mistakes
MistakeUsing total contract value for deal size and comparing with first-year quota.
InsteadMeasure every term on the same basis as the target, here first-year revenue.
MistakeChasing one lever and ignoring its side effects.
InsteadRecalculate the whole formula; a gain in one term can be cancelled by a loss in another.
MistakeCalculating a new seller's win rate from a handful of deals.
InsteadUse the team rate until the seller has enough closed deals.
MistakeTreating velocity as an exact forecast.
InsteadUse it to compare periods and explain changes; forecast with the pipeline itself.
MistakeForgetting that cycle length divides.
InsteadA longer cycle slows velocity; shortening it speeds velocity up.
Summary and key terms
- Sales velocity is opportunities times average deal size times win rate, divided by cycle length, giving revenue per day.
- Ridgeline's velocity fell from about 8,724 to 5,674 dollars a day between the second and third quarters, implying about 803,000 and 522,000 dollars of bookings against actual results of 744,000 and 591,000.
- Splitting the change showed that fewer opportunities, smaller deals, a lower win rate and longer cycles all contributed.
- Each multiplying lever raises velocity in proportion, and small gains in all four multiply to a large gain.
- The levers interact, so recalculate the whole formula.
- For individual sellers, use the team win rate until there is enough data.
- Velocity explains changes; it is not a precise forecast.
- Sales velocity
- The rate at which a pipeline produces revenue, in dollars per day.
- Sales cycle length
- The time from creating an opportunity to closing it.
- Lever
- One of the four terms of velocity a team can act on.
- Average deal size
- Total value of won deals divided by the number won.
- Steady pipeline
- The model's assumption that opportunities enter and close at a fairly constant rate.
Practice problems
Work each problem on paper first, then reveal the answer to check.
A seller has 20 opportunities, an average deal of 15,000 dollars, a win rate of 25 in 100 and a 50-day cycle. What is the velocity?
Show answer
20 × 15,000 × 0.25 ÷ 50 = 1,500 dollars per day.
If that seller shortens the cycle to 40 days, what is the new velocity?
Show answer
75,000 ÷ 40 = 1,875 dollars per day.
Why might qualifying harder leave velocity unchanged?
Show answer
It can raise win rate but reduce the number of opportunities by a similar proportion.
Lesson quiz · 5 questions
Score 60% or more to complete this lesson.
Create a free account to save your progress, take quizzes and earn a certificate.