
SLS-130 · Lesson 10 of 12 · 19 min
Measuring satisfaction: CSAT, NPS and effort
▶ Video coming soon A video version of this lesson is on the way.
By early November 2026, Juniper & Pine had changed a great deal about its service: delivery texts, a call-back option, a help centre, clearer promises and a complaint log. Bev's regional director asked a reasonable question: "Is it working?" The store had plenty of operational numbers, such as calls answered and complaints logged. What it lacked was a consistent way to ask customers how they felt. Tessa Yellowbird and Bev spent a week choosing what to measure.
This lesson explains the three customer feedback measures most widely used in service: customer satisfaction, often called CSAT; the Net Promoter Score, or NPS; and customer effort. It shows how each is calculated, what each is good for, the known criticisms of each, and how to design surveys that produce trustworthy results. It also explains why survey scores should never be used alone.
Customer satisfaction (CSAT)
A CSAT question asks customers how satisfied they were with a specific interaction or experience, usually right after it happens. A typical version is: "How satisfied were you with your delivery today?" with answers on a five-point scale from very dissatisfied (1) to very satisfied (5).
CSAT is usually reported as the share of respondents who chose the top two answers, 4 or 5, sometimes called the top-two-box score. Some organizations report the average score instead. The two methods give different numbers for the same responses, so it matters which one is used, and it should stay the same over time so results can be compared.
CSAT's strength is that it is simple, easy for customers to answer and closely tied to a specific moment. Asking right after a delivery or a service call shows how that interaction went and can be traced to the people and processes involved. Its weakness is that it measures a moment, not a relationship. A customer can be satisfied with today's call and still be planning to leave because of six earlier problems.
Worked problem
Calculating CSAT two ways
In the first week of November 2026, 160 customers answered Juniper & Pine's delivery survey. Their answers were: 5 (very satisfied): 72; 4: 48; 3: 20; 2: 12; 1 (very dissatisfied): 8. Calculate the top-two-box CSAT and the average score.
Show solution
- Check the total: 72 + 48 + 20 + 12 + 8 = 160.
- Top-two-box: (72 + 48) ÷ 160 × 100 = 120 ÷ 160 × 100 = 75 in 100.
- Average: (5 × 72 + 4 × 48 + 3 × 20 + 2 × 12 + 1 × 8) ÷ 160.
- Numerator: 360 + 192 + 60 + 24 + 8 = 644. Average: 644 ÷ 160 = 4.025, about 4.0 out of 5.
Answer: Top-two-box CSAT is 75 in 100, and the average score is about 4.0 out of 5. Both describe the same answers; the store should choose one method and keep using it.
Net Promoter Score (NPS)
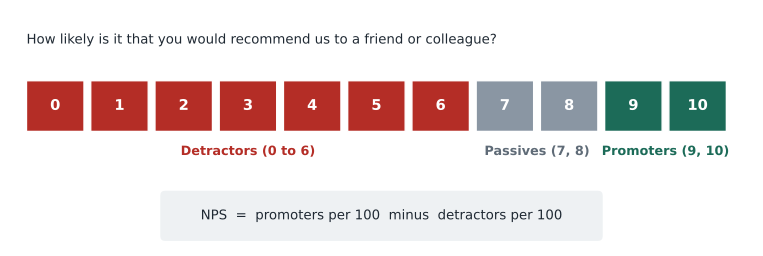
The Net Promoter Score was introduced by Frederick Reichheld of the consulting firm Bain & Company in a 2003 Harvard Business Review article, "The One Number You Need to Grow". It asks a single question: "How likely is it that you would recommend this company to a friend or colleague?" on a scale from 0 (not at all likely) to 10 (extremely likely).
Respondents are divided into three groups. Those who answer 9 or 10 are promoters, 7 or 8 are passives, and 0 to 6 are detractors. The score is the share of promoters minus the share of detractors, expressed as a whole number between −100 (everyone a detractor) and +100 (everyone a promoter). Passives count in the total but in neither group.
Worked problem
Calculating NPS
Juniper & Pine sends the recommendation question to customers 30 days after a purchase. In October 2026, 250 customers responded: 105 answered 9 or 10; 85 answered 7 or 8; and 60 answered 0 to 6. Calculate the store's NPS.
Show solution
- Check the total: 105 + 85 + 60 = 250.
- Promoters: 105 ÷ 250 × 100 = 42 in 100.
- Detractors: 60 ÷ 250 × 100 = 24 in 100.
- NPS = 42 − 24 = 18.
- Passives (85 ÷ 250 × 100 = 34 in 100) are not added or subtracted, but they still count in the total of 250.
Answer: The store's NPS is +18. If 20 of the passives became promoters next month with the same number of responses, promoters would rise to 125 ÷ 250 × 100 = 50 in 100 and NPS to 26, which shows how much the score depends on movement around the 7 to 9 boundary.
What NPS is good for, and its criticisms
NPS became popular because it is simple, easy to explain to executives and easy to compare across business units. Asking about recommendation also captures something important: a customer willing to put their own reputation behind a business is likely to be loyal. Many companies follow the score question with an open question, "What is the main reason for your score?", and the answers are often more useful than the number.
NPS has also been heavily criticized, and a professional should know the main criticisms. In 2007 Timothy Keiningham and colleagues, writing in the Journal of Marketing, tested Reichheld's claim that NPS was the best single predictor of growth and could not confirm it; other satisfaction and loyalty measures predicted growth about as well. Critics also point out that:
- The grouping throws away information. A customer who moves from 0 to 6 changes nothing in the score, while one who moves from 8 to 9 changes it.
- Because it subtracts one share from another, NPS has a wide margin of error in small samples, so month-to-month changes are often just noise.
- The 9-or-10 cut-off may not suit every culture or industry; people in some places rarely give top scores.
- Recommendation may not be a natural behaviour for some products, such as business software chosen by procurement or a funeral service.
- When staff pay or bonuses depend on the score, people may ask customers for high scores or choose whom to survey, which makes the number meaningless.
None of this makes NPS useless. It means NPS works best as one signal among several, tracked over time with enough responses, read together with the comments, and never tied directly to individual pay.
Customer effort
In 2010 Matthew Dixon, Karen Freeman and Nicholas Toman published a Harvard Business Review article called "Stop Trying to Delight Your Customers". Based on surveys of customers who had contacted service teams, they argued that going beyond expectations did little for loyalty, while reducing the effort customers had to make, such as repeat contacts, transfers and having to repeat information, did a great deal. Their measure of this became known as the Customer Effort Score, or CES.
A common current form asks customers to agree or disagree with a statement such as "The company made it easy for me to handle my issue", on a seven-point scale from strongly disagree to strongly agree. Results are reported as an average, or as the share who agree (5, 6 or 7). Effort questions work best for service interactions and processes, such as returns, repairs or rebooking, rather than for the whole relationship.
The effort research reinforced themes from earlier lessons: first contact resolution, warm transfers, shared records so customers need not repeat themselves, and honest information about next steps. The original findings came from the authors' own research company, so later studies are worth reading too, but the core idea, that reducing hassle matters more than adding delight, is widely supported.
| Measure | Typical question | Best for | Main limitation |
|---|---|---|---|
| CSAT | How satisfied were you with your delivery today? (1 to 5) | Specific interactions and touchpoints | Measures a moment, not the relationship |
| NPS | How likely are you to recommend us to a friend or colleague? (0 to 10) | Overall relationship, tracked over time | Noisy in small samples; discards detail; easy to game |
| Customer effort | The company made it easy for me to handle my issue. (1 to 7) | Service processes such as returns and repairs | Narrow; does not capture value or product quality |
Designing a survey people will answer honestly
Even the best measure produces useless numbers if the survey is badly designed. A few principles help.
- Keep it short: one or two scored questions and one open question. Long surveys lose respondents, and the ones who finish are not typical.
- Ask soon after the experience, while the customer remembers it.
- Ask neutral questions. "How satisfied were you with our excellent service?" pushes people toward a higher score.
- Survey everyone eligible, or a random sample, not only the customers staff think will be happy.
- Do not ask customers for a particular score. Staff who say "please give me a 10" make the results worthless.
- Track the response rate, the share of customers who answer. If only a small, unusual group responds, the results may not represent customers as a whole.
- Follow up with customers who give low scores, where they have agreed to be contacted. This is often called closing the loop with the customer, the same idea as in lesson 4.
Electronic surveys must also respect CASL and privacy rules, as discussed in lesson 8. A survey email that also contains a promotional offer is treated as a marketing message.
Small samples and margins of error
Survey results always involve some chance variation. With small numbers of responses, scores can swing a lot from month to month for no real reason. A rough guide is that for a share such as top-two-box CSAT, the margin of error at the usual 95 in 100 confidence level is about one divided by the square root of the number of responses. With 100 responses that is about 1 ÷ 10 = 0.10, or 10 points in 100. With 400 responses it is about 1 ÷ 20, or 5 points. NPS, which is a difference of two shares, has a larger margin of error still. Before celebrating or worrying about a change of a few points, check whether there were enough responses for it to mean anything.
Measuring satisfaction in business accounts
Business-to-business firms use the same measures but often differently. Response numbers are small, because there are few customers, so individual comments matter more than averages. Several people at each customer may be surveyed, and their answers can differ sharply: at Riverbend Dental Group, Helen Park might be a promoter while the finance clerk who struggles with invoices is a detractor. Ridgeline therefore asks the recommendation question of three contacts at each major account once a year, and Maya reads every answer and comment for her accounts. A detractor at a key account gets a phone call from the account executive within a week.
Many business sellers also hold regular business reviews with customers, conversations that cover service performance, problems and plans. SLS-220 covers these in detail. A single survey score cannot replace them.
Never use scores alone
Survey scores are opinions, and opinions are only part of the picture. Good service measurement combines them with operational measures from lesson 8, such as first contact resolution and response times; with complaint data from lesson 5; and with behaviour, such as whether customers actually return and buy again, which lesson 11 covers. When survey scores rise but repeat purchases fall, the behaviour is the stronger evidence.
Common mistakes
MistakeChanging between top-two-box and average CSAT from month to month.
InsteadChoose one method and keep it, so results can be compared over time.
MistakeTreating a few points of change in NPS as meaningful.
InsteadCheck the number of responses; small samples produce large random swings.
MistakeTying staff bonuses directly to survey scores.
InsteadUse scores to learn and improve; linking them to pay invites gaming that destroys their value.
MistakeAsking leading questions or asking customers for top scores.
InsteadAsk neutral questions and survey everyone eligible or a random sample.
MistakeRelying on one score for everything.
InsteadCombine CSAT, NPS or effort with comments, operational data, complaints and actual customer behaviour.
Summary and key terms
- CSAT asks how satisfied customers were with a specific interaction, usually on a 1 to 5 scale, reported as top-two-box share or average.
- NPS asks how likely customers are to recommend the business on a 0 to 10 scale; promoters (9 to 10) minus detractors (0 to 6) gives a score from −100 to +100.
- NPS is simple and popular, but research has not confirmed it predicts growth better than other measures, and it is noisy, discards detail and is easy to game.
- Customer effort measures how easy it was to get an issue handled, building on Dixon, Freeman and Toman's finding that reducing effort matters more than delight.
- Good surveys are short, timely, neutral and unbiased, with tracked response rates and follow-up of low scores.
- Small samples have large margins of error.
- Scores should be combined with comments, operational data, complaints and customer behaviour.
- CSAT
- Customer satisfaction score, measuring satisfaction with a specific interaction or experience.
- Top-two-box
- The share of respondents choosing the two highest answers on a scale.
- Net Promoter Score
- Promoters per 100 minus detractors per 100, from a 0 to 10 likelihood-to-recommend question.
- Promoter, passive, detractor
- NPS groups for answers of 9 to 10, 7 to 8, and 0 to 6.
- Customer Effort Score
- A measure of how easy it was for the customer to get an issue handled.
- Response rate
- The share of customers asked who answer the survey.
Practice problems
Work each problem on paper first, then reveal the answer to check.
In 200 NPS responses, 90 are promoters and 50 are detractors. What is the NPS?
Show answer
90 ÷ 200 × 100 = 45; 50 ÷ 200 × 100 = 25; NPS = 45 − 25 = 20.
Give two criticisms of NPS.
Show answer
Any two of: research has not confirmed it predicts growth better than other measures; it is noisy in small samples; grouping discards information; cut-offs may not suit all cultures; it is easy to game when tied to pay.
About how large is the margin of error on a share measured from 225 responses?
Show answer
1 ÷ √225 = 1 ÷ 15, about 0.067, or roughly 7 points in 100.
Lesson quiz · 5 questions
Score 60% or more to complete this lesson.
Create a free account to save your progress, take quizzes and earn a certificate.