
ROB-430 · Lesson 7 of 12 · 28 min
Trust, acceptance and over-reliance
Whether people use a robot well depends less on how capable the robot is than on how well people's trust in it matches its capability. A worker who distrusts a reliable robot will double-check everything, slow the process down and may disable useful features. A worker who trusts an unreliable robot will stop watching it and fail to catch its errors. Both are failures of trust calibration. This lesson defines trust in automation and robots, explains the factors that shape it, looks at the evidence on over-reliance, including a well-known study in which people followed a robot during a simulated fire, and introduces models of technology acceptance used to predict whether people will adopt a robot at all.
What trust means
John Lee and Katrina See, in an influential 2004 review, defined trust as the attitude that an agent will help achieve an individual's goals in a situation characterized by uncertainty and vulnerability. Two features of this definition matter. First, trust is an attitude, which is different from reliance, the behaviour of actually depending on the system. People can say they distrust a robot and still rely on it because they have no choice, or say they trust it and still monitor it closely. Second, trust only matters when there is uncertainty and something at stake. Nobody needs to trust a robot whose actions have no consequences.
Lee and See described three bases for trust. Performance is what the system does: its reliability and competence. Process is how it does it: whether its methods are understandable and appropriate. Purpose is why it does it: whether its designers' intentions align with the user's interests. A robot can earn performance-based trust through a good track record, process-based trust by explaining its reasoning, and purpose-based trust by being clearly designed to serve its users rather than, say, to monitor them for an employer.
Calibration, resolution and specificity
Trust is well calibrated when it matches the system's actual capability. Overtrust is trust that exceeds capability, which leads to misuse; distrust is trust below capability, which leads to disuse. Resolution describes how well trust tracks changes in capability, for example falling when the robot is in a situation where it performs poorly and rising again when conditions improve. Specificity describes how finely trust is differentiated: a well-calibrated user may trust a robot's navigation but not its object recognition in dim light.
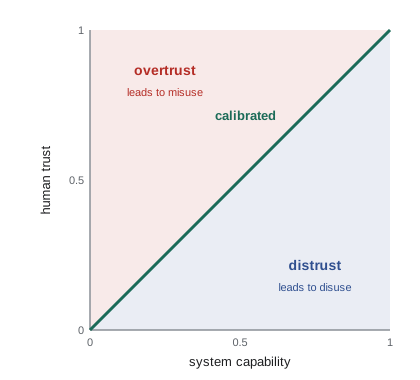
Raja Parasuraman and Victor Riley, in a 1997 paper, described three ways automation goes wrong in human hands. Misuse is over-reliance: using automation when it should not be used, or failing to monitor it. Disuse is under-use: ignoring or turning off automation that would help, often because of false alarms. Abuse is designers or managers automating functions without regard for the consequences for the human operator. All three appear in HRI. Automation bias, a related idea, is the tendency to favour suggestions from automated systems and to miss errors that the system does not flag, including errors of commission (following a wrong recommendation) and errors of omission (failing to act because the system did not alert).
What shapes trust in robots
Peter Hancock and colleagues published a meta-analysis in 2011 of factors associated with trust in robots. They grouped factors into robot-related factors (performance, such as reliability and failure rates, and attributes, such as appearance and proximity), human-related factors (such as personality, experience and expertise) and environmental factors (such as task type and team context). Robot performance factors had the strongest association with trust, while robot attributes and environmental factors had smaller associations, and human-related factors were weakly associated in the studies available at the time. A later meta-analysis by the same group broadened these findings, but the main message held: how well the robot performs matters more than how it looks.
| Factor group | Examples | Association with trust (Hancock et al., 2011) |
|---|---|---|
| Robot performance | Reliability, failure rate, predictability, transparency | Strongest |
| Robot attributes | Appearance, anthropomorphism, proximity, personality | Smaller |
| Environment | Task type, team collaboration, culture | Moderate, fewer studies |
| Human | Experience, expertise, attitudes, self-confidence | Weak in available studies |
Trust also changes over time. It tends to build slowly with successful experience and drop quickly after failures, especially failures that are severe, surprising or early in the relationship. A failure the person can understand and predict does less damage than one that seems random. Trust can be repaired, partly, through explanations, apologies, promises and demonstrated improvement, though studies disagree on which strategies work best and whether a robot's apology helps or seems hollow.
# Trust dynamics: asymmetric update toward observed outcomes, compared with true reliability
import numpy as np
rng = np.random.default_rng(430)
def run(reliability, n=200, up=0.05, down=0.20, t0=0.5):
    t, hist = t0, []
    for _ in range(n):
        ok = rng.random() < reliability
        t += (up * (1 - t)) if ok else (-down * t)      # failures weigh more than successes
        hist.append(t)
    return np.array(hist)
for r in (0.70, 0.90, 0.98):
    h = run(r)
    print(f"reliability {r:.2f}: trust after 20 trials {h[19]:.2f}, mean of last 100 {h[100:].mean():.2f}, "
f"min {h.min():.2f}")reliability 0.70: trust after 20 trials 0.16, mean of last 100 0.35, min 0.12 reliability 0.90: trust after 20 trials 0.48, mean of last 100 0.65, min 0.36 reliability 0.98: trust after 20 trials 0.69, mean of last 100 0.81, min 0.53
The simple model above, in which each success nudges trust up a little and each failure knocks it down more, captures the asymmetry seen in many experiments. It also shows that trust in a moderately reliable robot fluctuates widely, which matters for consistent use. Real trust is more complex, depending on the context of each failure and on the person, but such models help designers reason about how reliability, failure visibility and explanations interact.
Overtrust: evidence from studies
One of the most cited HRI studies on overtrust was conducted by Paul Robinette and colleagues at Georgia Tech and published in 2016. Participants were led by an emergency guide robot to a meeting room; for some, the robot visibly malfunctioned along the way, taking a wrong turn or going in circles. While they filled in a questionnaire, the building filled with artificial smoke and a fire alarm sounded. As they left, the robot pointed them toward a dark back route rather than the marked exit they had entered through. Almost all participants followed the robot, including those who had just seen it malfunction. Some followed it into a dark room blocked by furniture. The study used a small sample in one setting, and the authors discuss alternative explanations, such as participants assuming the robot was part of the experiment's instructions, but it remains a vivid illustration that people may defer to a robot in an emergency even when they have evidence it is unreliable.
Over-reliance shows up in less dramatic ways too. Drivers using partial driving automation look away from the road for longer as they gain experience. Pilots and clinicians miss errors that automated aids do not flag. In collaborative manufacturing, workers who have seen a robot perform perfectly for weeks may stop checking its output. The design response is not to make people distrust robots, but to support appropriate reliance: make the robot's capability and current state visible, signal uncertainty, keep the human engaged in meaningful parts of the task, and test what people actually do, not just what they say.
Alarms, false alarms and the cry-wolf effect
Robots often warn people about hazards or ask them to check something. The usefulness of a warning depends on its hit rate and false-alarm rate and on how often the hazard actually occurs. Signal detection theory separates sensitivity, the ability to distinguish hazard from no hazard, from the decision threshold. When hazards are rare, even a sensitive detector produces many false alarms relative to true ones. People then learn that most alarms are false and respond slowly or not at all, the cry-wolf effect described by the psychologist Shlomo Breznitz in 1984 and studied in alarm research by James Bliss and others.
Worked problem
How believable is the alarm?
A robot's vision system warns a worker when it thinks a part is defective. It detects 95 per cent of real defects and raises false alarms on 5 per cent of good parts. Defects occur on 2 per cent of parts. What fraction of alarms are real defects?
Show solution
- True alarms per part: \( 0.95 \times 0.02 = 0.019 \).
- False alarms per part: \( 0.05 \times 0.98 = 0.049 \).
- PPV: \( 0.019/(0.019 + 0.049) \approx 0.28 \).
Answer: Only about 28 per cent of alarms are real defects, so workers may learn to dismiss them; lowering the false-alarm rate or showing the evidence for each alarm helps restore credibility.
Worked problem
Calibration error from survey and logs
Five workers rate their trust in a robot's defect detection on a 0 to 1 scale as 0.9, 0.8, 0.95, 0.6 and 0.85. Logs show the robot's actual detection accuracy in their lines is 0.75, 0.8, 0.7, 0.85 and 0.8. Compute each worker's calibration error (trust minus accuracy) and the mean absolute error.
Show solution
- Errors: \( 0.15, 0.00, 0.25, -0.25, 0.05 \).
- Absolute values: \( 0.15, 0.00, 0.25, 0.25, 0.05 \); mean \( 0.70/5 = 0.14 \).
- Three workers overtrust, one is calibrated and one distrusts.
Answer: A mean absolute calibration error of 0.14, with overtrust in three of five cases; targeted feedback on actual accuracy could improve calibration.
Measuring trust
Trust can be measured by questionnaire or by behaviour. The Trust in Automation scale developed by Jiun-Yin Jian, Ann Bisantz and Colin Drury in 2000 has 12 items, such as statements about whether the system is deceptive, reliable or dependable, rated on seven-point scales. Kristin Schaefer's Trust Perception Scale-HRI, published in 2016, was developed specifically for robots, with a 40-item version and a shorter 14-item version, and asks participants what percentage of the time the robot exhibits properties such as being dependable or acting consistently. Behavioural measures include reliance (how often people accept the robot's recommendation or let it act), compliance (how often they follow its warnings), monitoring (how often they check its work, measured by eye tracking or by checks performed) and intervention (how often they take over). Because attitudes and behaviour can diverge, good studies use both, and lesson 8 discusses how to choose validated measures.
Acceptance of robots
Trust is one ingredient of acceptance, the decision to adopt and keep using a robot. The Technology Acceptance Model, TAM, proposed by Fred Davis in 1989, predicts intention to use a technology from its perceived usefulness and perceived ease of use. The Unified Theory of Acceptance and Use of Technology, UTAUT, developed by Viswanath Venkatesh and colleagues in 2003, adds social influence and facilitating conditions, with moderators such as age, gender and experience. For assistive social robots used by older adults, Marcel Heerink and colleagues proposed the Almere model in 2010, adding constructs such as perceived enjoyment, social presence, trust and anxiety.
In workplaces, acceptance also depends on how the robot affects jobs. Workers may fear that a robot will replace them, intensify the pace of work, monitor them or remove the skilled parts of their jobs. Introducing robots with worker involvement, clear communication about job impacts, training, and designs that remove the dull, dirty and dangerous parts of work tends to improve acceptance. Unionized workplaces may negotiate the terms of automation through collective agreements. Lesson 11 returns to the social impact of robots on employment.
| Model | Core predictors | Typical use in HRI |
|---|---|---|
| TAM (Davis, 1989) | Perceived usefulness, perceived ease of use | Quick surveys of intention to use a robot |
| UTAUT (Venkatesh et al., 2003) | Performance expectancy, effort expectancy, social influence, facilitating conditions | Organizational adoption of robots |
| Almere model (Heerink et al., 2010) | Adds enjoyment, social presence, trust, anxiety, attitude | Assistive social robots for older adults |
Designing for calibrated trust
Several design strategies support calibrated trust. Transparency means showing what the robot is doing, why and how confident it is, for example by displaying detected objects with confidence levels, or explaining why it stopped. Studies of agent transparency, including Jessie Chen's situation-awareness-based agent transparency model, suggest that showing the robot's reasoning and projected outcomes can improve calibration without excessive workload. Communicating uncertainty helps people know when to double-check. Graceful failure, where the robot recognizes its limits and asks for help rather than failing silently, builds process-based trust. Early exposure to failures in training, so people know what failures look like, reduces the shock of later failures. And keeping people meaningfully engaged, rather than relegating them to passive monitoring, reduces complacency.
Common mistakes
MistakeAiming to maximize trust in a robot.
InsteadAim for calibrated trust that matches capability, including knowing where the robot is weak.
MistakeMeasuring trust only with a questionnaire.
InsteadCombine attitude measures with behavioural measures such as reliance, compliance and monitoring.
MistakeIgnoring base rates when designing alarms.
InsteadCompute positive predictive value; rare hazards make false alarms dominate.
MistakeAssuming a humanlike appearance will build trust.
InsteadRobot performance has the strongest association with trust; appearance has smaller effects.
MistakeTreating worker resistance as irrational.
InsteadAddress concerns about jobs, pace, monitoring and skill through involvement and transparent design.
Summary and key terms
- Trust is an attitude that an agent will help achieve one's goals under uncertainty and vulnerability; reliance is the behaviour.
- Trust rests on performance, process and purpose, and should be calibrated to capability.
- Overtrust leads to misuse, distrust to disuse, and careless automation design to abuse.
- Robot performance is the factor most strongly associated with trust in the 2011 meta-analysis.
- Trust builds slowly and falls quickly; repair through explanation and improvement is partial.
- Low base rates make false alarms dominate, causing the cry-wolf effect.
- TAM, UTAUT and the Almere model predict acceptance; transparency supports calibrated trust.
- Trust
- The attitude that an agent will help achieve one's goals under uncertainty and vulnerability.
- Reliance
- The behaviour of depending on a system.
- Calibration
- The match between trust and actual system capability.
- Misuse
- Over-reliance on automation.
- Disuse
- Under-use or rejection of helpful automation.
- Automation bias
- Favouring automated suggestions and missing unflagged errors.
- Positive predictive value
- The share of alarms that correspond to real hazards.
- Cry-wolf effect
- Reduced response to alarms after many false alarms.
- Technology Acceptance Model
- Davis' model predicting intention to use from usefulness and ease of use.
- Transparency
- Showing a robot's state, reasoning and confidence to users.
Practice problems
Work each problem on paper first, then reveal the answer to check.
Name Lee and See's three bases of trust.
Show answer
Performance, process and purpose.
What is the difference between trust and reliance?
Show answer
Trust is an attitude; reliance is behaviour.
Define misuse and disuse.
Show answer
Misuse is over-reliance; disuse is under-use of helpful automation.
Hit rate 0.9, false-alarm rate 0.1, base rate 0.1: PPV?
Show answer
\( 0.09/(0.09 + 0.09) = 0.5 \).
Which factor group had the strongest association with trust in Hancock et al. 2011?
Show answer
Robot performance.
What did the 2016 emergency guide robot study show?
Show answer
Most participants followed a robot in a simulated fire even after seeing it malfunction.
Name two behavioural measures of trust.
Show answer
Reliance, compliance, monitoring or intervention.
What are TAM's two main predictors?
Show answer
Perceived usefulness and perceived ease of use.
Why does trust often fall more after early failures?
Show answer
Early failures shape initial expectations and there is little positive history to offset them.
Give one design strategy for calibrated trust.
Show answer
Transparency, communicating uncertainty, graceful failure, exposure to failures in training.
Lesson quiz · 5 questions
Score 60% or more to complete this lesson.
Create a free account to save your progress, take quizzes and earn a certificate.