
ROB-310 · Lesson 5 of 12 · 29 min
The Kalman filter
The Kalman filter is the Bayes filter for linear systems with Gaussian noise, and in that setting it is exact: no approximation, just a handful of matrix equations that update a mean and a covariance. Published by Rudolf Kálmán in 1960 and soon used to navigate the Apollo spacecraft, it remains the most widely used estimator in engineering. Every phone, drone, car and industrial robot runs some form of it. Even where systems are nonlinear, the extended and unscented filters of lessons 6 and 7 keep the Kalman structure and only change how the means and covariances are propagated. This lesson builds the filter from the one-dimensional case, where the equations reduce to intuitive averaging, up to the full matrix form, and then covers the practical questions every implementer faces: how to choose the noise covariances and how to tell whether the filter is working.
Fusing two Gaussians
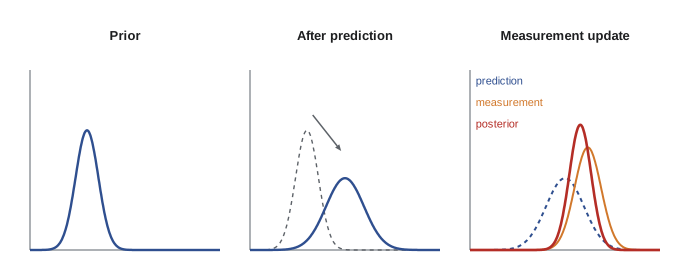
Suppose a robot believes its position is \( \mathcal{N}(\mu_1, \sigma_1^2) \) and then receives a measurement that, on its own, suggests \( \mathcal{N}(\mu_2, \sigma_2^2) \). Multiplying the two Gaussians, as Bayes' rule requires, gives another Gaussian with
The new mean is a weighted average that trusts the more certain source more, and the new variance is smaller than either: inverse variances, called information, simply add. Rewriting the mean as \( \mu = \mu_1 + K(\mu_2 - \mu_1) \) with \( K = \sigma_1^2/(\sigma_1^2 + \sigma_2^2) \) gives the Kalman form: start from the prior, and move toward the measurement by a fraction K of the disagreement. K, the Kalman gain, is near 1 when the prior is vague relative to the measurement and near 0 when the measurement is the noisy one.
Worked problem
Fusing a prediction with a measurement
A robot predicts its position along a rail as 10.0 m with σ = 0.4 m. A sensor measures 10.6 m with σ = 0.3 m. Find the fused estimate.
Show solution
- Variances: 0.16 and 0.09. Gain: \( K = 0.16/(0.16 + 0.09) = 0.64 \).
- Mean: \( 10.0 + 0.64(10.6 - 10.0) = 10.384 \) m.
- Variance: \( (1 - 0.64)(0.16) = 0.0576 \) m², so σ = 0.24 m.
Answer: The fused estimate is 10.38 m with σ = 0.24 m, closer to the more precise sensor and more certain than either source alone. Information adds: \( 1/0.16 + 1/0.09 = 6.25 + 11.11 = 17.36 \), and \( 1/17.36 = 0.0576 \).
The linear Gaussian system model
The Kalman filter assumes the state evolves and is observed linearly, with additive Gaussian noise:
A is the state transition matrix, B maps controls into the state, H is the measurement matrix and Q and R are the process and measurement noise covariances. (Some texts, including Probabilistic Robotics, swap the letters and call process noise R and measurement noise Q; always check a source's convention.) The process noise w represents everything the motion model leaves out, from unmodelled accelerations to wheel slip, and the measurement noise v represents sensor error. Under these assumptions, with a Gaussian initial belief, the belief stays Gaussian forever, and the filter only needs to track its mean \( \boldsymbol{\mu} \) and covariance \( \boldsymbol{\Sigma} \).
The filter equations
The prediction step applies the rules of lesson 1 for linear maps of Gaussians:
The correction step computes the innovation \( \mathbf{y}_t = \mathbf{z}_t - \mathbf{H}\bar{\boldsymbol{\mu}}_t \), the difference between what was measured and what was expected; its covariance \( \mathbf{S}_t = \mathbf{H}\bar{\boldsymbol{\Sigma}}_t\mathbf{H}^{\mathsf{T}} + \mathbf{R} \); the Kalman gain; and the updated belief:
These are the matrix versions of the one-dimensional fusion formulas. The gain matrix K does more than weight: it spreads the correction across all state components according to their covariance with what was measured. A position-only measurement in a filter whose state includes velocity also corrects the velocity, because predicted position and velocity are correlated through the motion model. This is how a Kalman filter estimates quantities it never measures directly. Numerically, the simple covariance update can lose symmetry or positive definiteness through rounding, so careful implementations use the Joseph form \( \boldsymbol{\Sigma}_t = (\mathbf{I} - \mathbf{K}\mathbf{H})\bar{\boldsymbol{\Sigma}}(\mathbf{I} - \mathbf{K}\mathbf{H})^{\mathsf{T}} + \mathbf{K}\mathbf{R}\mathbf{K}^{\mathsf{T}} \), which stays symmetric and positive definite for any gain.
A constant-velocity tracking filter
A common first filter tracks an object moving along a line, such as a robot on a rail or a conveyor item, with state \( \mathbf{x} = [p, v]^{\mathsf{T}} \) of position and velocity, from noisy position measurements every Δt seconds. Assuming velocity is roughly constant but disturbed by random accelerations of spectral density q,
This continuous white-noise acceleration model gives a Q whose structure, with correlated position and velocity noise, follows from integrating random acceleration over a step. The single tuning parameter q expresses how much the velocity is expected to wander: small q gives smooth but sluggish estimates that lag behind real speed changes; large q gives responsive but noisy estimates.
Worked problem
One cycle of the constant-velocity filter
With Δt = 1 s, the prior is \( \boldsymbol{\mu} = [0, 1]^{\mathsf{T}} \), \( \boldsymbol{\Sigma} = \text{diag}(1, 1) \), and to keep numbers simple Q = 0. A position measurement z = 1.5 arrives with R = 1. Find the posterior mean.
Show solution
- Predict: \( \bar{\boldsymbol{\mu}} = [1, 1]^{\mathsf{T}} \); \( \bar{\boldsymbol{\Sigma}} = \mathbf{A}\mathbf{A}^{\mathsf{T}} = \begin{bmatrix} 2 & 1 \\ 1 & 1 \end{bmatrix} \).
- Innovation: \( 1.5 - 1 = 0.5 \); S = 2 + 1 = 3.
- Gain: \( \mathbf{K} = [2, 1]^{\mathsf{T}}/3 = [0.667, 0.333]^{\mathsf{T}} \).
- Update: \( \boldsymbol{\mu} = [1 + 0.333,\ 1 + 0.167]^{\mathsf{T}} = [1.333, 1.167]^{\mathsf{T}} \).
Answer: The position moves two thirds of the way toward the measurement, to 1.333, and the velocity rises from 1.0 to 1.167 m/s even though velocity was never measured. The correlation of 1 in the predicted covariance is what carried the correction into the velocity.
import numpy as np
rng = np.random.default_rng(5)
dt, q, sz, T = 0.1, 0.5, 0.2, 300
A = np.array([[1, dt], [0, 1]]); H = np.array([[1.0, 0.0]])
Q = q*np.array([[dt**3/3, dt**2/2], [dt**2/2, dt]]); R = np.array([[sz**2]])
x = np.array([0.0, 1.0]); mu = np.array([0.0, 0.0]); S = np.diag([1.0, 1.0])
err, nees = [], []
for t in range(T):
    x = A @ x + rng.multivariate_normal([0, 0], Q)           # true motion
    z = H @ x + rng.normal(0, sz, 1)                          # noisy position
    mu = A @ mu; S = A @ S @ A.T + Q                          # predict
    y = z - H @ mu; Sy = H @ S @ H.T + R; K = S @ H.T @ np.linalg.inv(Sy)
    mu = mu + K @ y; IKH = np.eye(2) - K @ H
    S = IKH @ S @ IKH.T + K @ R @ K.T                         # Joseph form
    e = x - mu; err.append(e); nees.append(e @ np.linalg.inv(S) @ e)
err = np.array(err[50:]); nees = np.array(nees[50:])
print("position RMSE: %.3f m (measurement noise %.2f m)" % (np.sqrt(np.mean(err[:, 0]**2)), sz))
print("velocity RMSE: %.3f m/s" % np.sqrt(np.mean(err[:, 1]**2)))
print("steady-state gain:", np.round(K.ravel(), 3))
print("mean NEES: %.2f (expected 2 for a consistent 2-state filter)" % nees.mean())position RMSE: 0.130 m (measurement noise 0.20 m) velocity RMSE: 0.410 m/s steady-state gain: [0.377 0.883] mean NEES: 2.06 (expected 2 for a consistent 2-state filter)
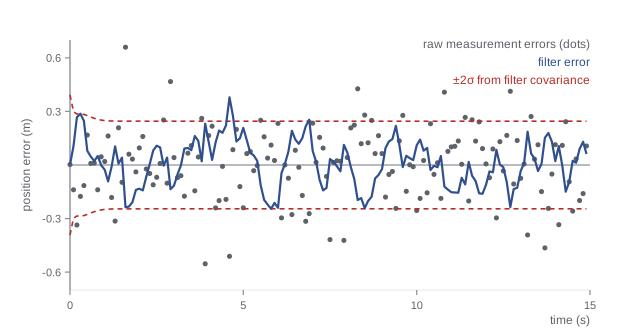
The filter cuts the position error from the raw 0.20 m measurement noise to 0.13 m by averaging over time, and it estimates velocity, which was never measured, to about 0.4 m/s even though the true velocity wanders randomly; a smaller q would smooth the velocity estimate further at the cost of lag when the object really changes speed. The gain settles to a constant: for time-invariant systems the covariance converges, and many embedded implementations simply precompute this steady-state gain, giving a fixed-gain filter (closely related to the classic alpha–beta tracker) that costs only a few multiplications per step.
Tuning Q and R
The measurement noise R can usually be estimated directly by logging a sensor while the true value is constant and computing the variance, then inflating it a little for effects the bench test missed. The process noise Q is harder, because it stands for everything the model does not capture. It is normally tuned: start from a physically motivated value (for example, the typical random acceleration the platform experiences) and adjust until the filter's behaviour is right. The ratio of Q to R is what matters for the estimate; their absolute scale matters for the reported covariance. Too little Q makes the filter overconfident in its model, slow to follow real changes and prone to divergence, where the estimate drifts away while its covariance claims it is accurate. Too much Q makes the estimate jittery, following measurement noise.
Two consistency statistics turn tuning from guesswork into measurement. The normalized innovation squared, \( \text{NIS}_t = \mathbf{y}_t^{\mathsf{T}}\mathbf{S}_t^{-1}\mathbf{y}_t \), can be computed on real data and should average the measurement dimension (1 for a scalar measurement) if the filter is consistent. The normalized estimation error squared, \( \text{NEES}_t = \mathbf{e}_t^{\mathsf{T}}\boldsymbol{\Sigma}_t^{-1}\mathbf{e}_t \), needs the true state and so is used in simulation; it should average the state dimension. An average well above the expected value means the filter is overconfident (Σ too small, usually Q too small); well below means underconfident. In the simulation above the mean NEES is close to 2, the state dimension, as it should be when the filter's models match the simulated world.
Worked problem
Diagnosing a filter from NIS
A filter with scalar measurements reports an average NIS of 4.6 over 500 steps of real data. What does this suggest, and what would you try first?
Show solution
- For a consistent filter, the average NIS should be about 1 for a scalar measurement.
- An average of 4.6 means innovations are about \( \sqrt{4.6} = 2.1 \) times larger than the filter predicts.
- The filter's predicted innovation covariance S is too small: either R or the predicted state covariance (driven by Q) is too small.
Answer: The filter is overconfident. Check R against the sensor first; if R is right, increase Q until the average NIS approaches 1. If NIS spikes occasionally rather than being uniformly high, outliers are the likely cause, handled by gating in lesson 9.
Common mistakes
MistakeMixing up the Q and R conventions between sources
InsteadCheck which letter means process noise and which means measurement noise before copying equations.
MistakeSetting Q to zero for a "perfect" model
InsteadAlways include process noise; a zero-Q filter stops listening to measurements and diverges.
MistakeUsing the simple covariance update in single precision
InsteadUse the Joseph form and symmetrize Σ to keep it positive definite.
MistakeTuning only by looking at plots
InsteadCheck NIS on real data and NEES in simulation against their expected averages.
MistakeExpecting a position-only filter to ignore velocity
InsteadRemember the gain corrects all correlated states; model velocity if it matters.
Summary and key terms
- Fusing two Gaussians gives a precision-weighted average whose information is the sum of the two informations.
- The Kalman filter is the exact Bayes filter for linear systems with Gaussian process and measurement noise.
- Prediction propagates the mean through A and the covariance as \( \mathbf{A}\boldsymbol{\Sigma}\mathbf{A}^{\mathsf{T}} + \mathbf{Q} \).
- Correction uses the innovation, its covariance S and the gain \( \mathbf{K} = \bar{\boldsymbol{\Sigma}}\mathbf{H}^{\mathsf{T}}\mathbf{S}^{-1} \).
- Correlations let the filter correct unmeasured states such as velocity from position measurements.
- R is measured from sensor data; Q is tuned, trading responsiveness against smoothness.
- NIS and NEES averages test whether the filter's claimed uncertainty matches its actual errors.
- Kalman filter
- The recursive estimator for linear Gaussian systems that tracks a mean and covariance.
- Kalman gain
- The matrix that weights the innovation when correcting the state.
- Innovation
- The difference between the actual and predicted measurement.
- Process noise
- Random disturbance in the state evolution, with covariance Q.
- Measurement noise
- Random error in the measurement, with covariance R.
- Information
- The inverse of variance or covariance, which adds when independent sources are fused.
- Joseph form
- A numerically robust form of the covariance update.
- Divergence
- Growth of estimation error while the filter's covariance falsely claims accuracy.
- NIS
- Normalized innovation squared, a consistency test usable on real data.
- NEES
- Normalized estimation error squared, a consistency test using the true state.
Practice problems
Work each problem on paper first, then reveal the answer to check.
Fuse 5.0 (σ² = 4) with 6.0 (σ² = 1). Find the mean and variance.
Show answer
Mean 5.8, variance 0.8.
What is the Kalman gain for prior variance 1 and measurement variance 3?
Show answer
0.25.
If R is very large, what does K approach?
Show answer
Zero; the measurement is ignored.
Write the predicted covariance for A = 1, Σ = 0.5, Q = 0.1.
Show answer
0.6.
Why does a position-only measurement correct velocity?
Show answer
Position and velocity are correlated in the predicted covariance.
A 3-state filter shows mean NEES of 9 in simulation. Diagnose.
Show answer
Overconfident; covariance too small, likely Q too small.
What should the average NIS be for a 2-D measurement?
Show answer
About 2.
What does the Joseph form protect against?
Show answer
Loss of symmetry and positive definiteness from rounding.
Name the effect of making q too small in a tracker.
Show answer
Sluggish estimates that lag real velocity changes.
What classic fixed-gain filter is the steady state of the CV Kalman filter?
Show answer
The alpha–beta filter.
Lesson quiz · 5 questions
Score 60% or more to complete this lesson.
Create a free account to save your progress, take quizzes and earn a certificate.