
PET-499 · Lesson 5 of 12 · 20 min
Volumetrics and uncertainty
By week 5 the team has a gross rock volume, pool-average rock properties and a formation volume factor. Multiplying them gives one number for the oil in place. Ethan's response to the first draft is a question: “How sure are you?” The sponsor will not decide on a single number. It needs to know the range of outcomes, what drives the range, and how the range changes with the development option. This lesson turns the static model into a probabilistic estimate of oil in place and recoverable oil, identifies the inputs that matter most, and classifies the volumes under the resources framework.
The deterministic estimate
The volumetric oil in place is the pore volume filled with oil, divided by the formation volume factor to convert it to stock-tank volume:
where the gross rock volume is in cubic metres, giving N in stock-tank cubic metres. With the best estimates from Lessons 3 and 4, a gross rock volume of 50.4 million m³, net-to-gross of 0.75, porosity of 8.3 percent, water saturation of 14 percent and Boi of 1.446, the deterministic best estimate is 1.866 million m³, about 11.7 million barrels.
A deterministic estimate can be made for low, best and high cases by choosing low, best and high values of each input. That approach is common and quick, but it has a weakness: multiplying all the low values together gives a case that is far less likely than the low end of any one input, because it requires every input to be low at once. The probabilistic method avoids that by treating each input as a distribution and combining them by simulation.
Choosing input distributions
Each input distribution should express what the team actually knows, with its shape and range justified from the data. The team uses the following.
| Input | Distribution | Range | Basis |
|---|---|---|---|
| Gross rock volume | Triangular | 40, 49, 64 million m³ | Depth conversion uncertainty of about ±6 m at the flanks; skewed high because the flank dips are gentle |
| Net-to-gross | Triangular | 0.62, 0.75, 0.86 | Between the flank well and slightly better than the crest well |
| Porosity | Normal | mean 0.083, standard deviation 0.007 | Uncertainty of the pool average, not the scatter of individual samples |
| Water saturation | Triangular | 0.11, 0.14, 0.21 | Skewed high to allow for a higher cementation exponent in vuggy rock |
| Formation volume factor | Uniform | 1.43 to 1.46 | Laboratory and separator-adjustment uncertainty |
Two points from the table deserve emphasis. First, the porosity distribution describes the uncertainty in the pool average, which is much narrower than the spread of individual log samples. Using the sample spread would exaggerate the range of oil in place enormously, because a pool average over millions of cubic metres of rock cannot be as variable as one sample. Second, the inputs are treated as independent. In reality some are correlated: in this dolomite, porosity and water saturation are negatively correlated, because better rock holds less water. Ignoring a negative correlation widens the range slightly, which is conservative; ignoring a positive correlation would understate it. The team tests the effect and finds it small here.
Monte Carlo simulation
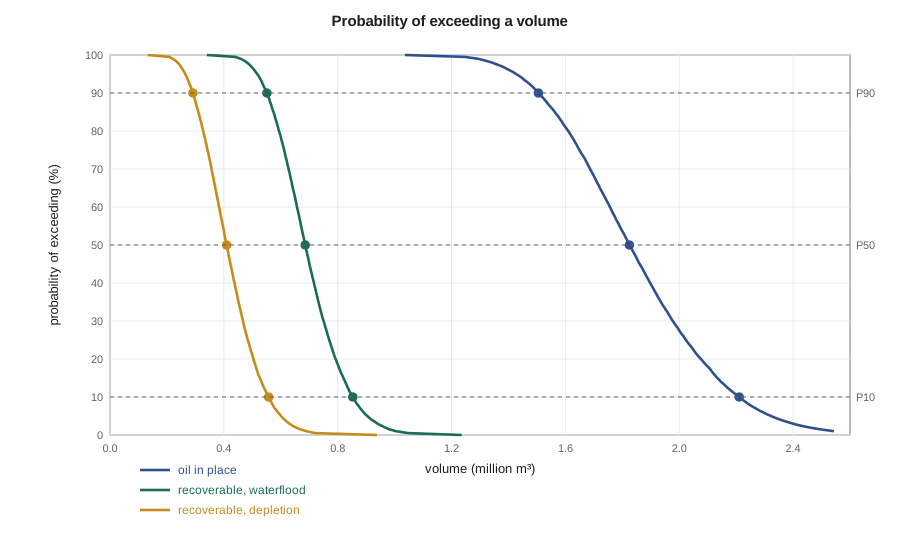
Monte Carlo simulation draws one value of each input at random from its distribution, calculates the oil in place, and repeats many thousands of times. The resulting values form the distribution of oil in place. By the industry convention, P90 is the value that has a 90 percent probability of being equalled or exceeded, P50 the median, and P10 the value with only a 10 percent probability of being exceeded. For recoverable volumes the team multiplies each trial's oil in place by a recovery factor drawn from a distribution for each recovery mechanism: natural depletion with an uncertain aquifer, between 12 and 34 percent with 22 percent most likely, and waterflooding from the start of production, between 30 and 45 percent with 38 percent most likely. These ranges come from analogous Nisku and Red River pools and will be refined by the reservoir engineering in Lessons 6 to 8.
# Deterministic and Monte Carlo oil in place for Spruce Ridge, and recoverable volumes for two recovery mechanisms.
import random
SI = True      # True: Canadian case (m3), False: US case (STB)
random.seed(499)
tri = random.triangular                          # triangular(low, high, mode)
if SI:
    c, unit = 1.0, "million m3"                  # GRV in m3
    grv_b, ntg_b, phi_b, sw_b, bo_b = 50.4e6, 0.75, 0.083, 0.14, 1.446
    draw_grv = lambda: tri(40e6, 64e6, 49e6)
    draw_ntg = lambda: tri(0.62, 0.86, 0.75)
    draw_phi = lambda: max(0.05, random.gauss(0.083, 0.007))
    draw_sw = lambda: tri(0.11, 0.21, 0.14)
    draw_bo = lambda: random.uniform(1.43, 1.46)
else:
    c, unit = 7758.0, "million STB"              # GRV in acre-ft; 7,758 bbl per acre-ft
    grv_b, ntg_b, phi_b, sw_b, bo_b = 28500.0, 0.62, 0.115, 0.22, 1.477
    draw_grv = lambda: tri(22000, 36000, 28000)
    draw_ntg = lambda: tri(0.50, 0.72, 0.62)
    draw_phi = lambda: max(0.06, random.gauss(0.115, 0.009))
    draw_sw = lambda: tri(0.17, 0.30, 0.22)
    draw_bo = lambda: random.uniform(1.46, 1.49)
ooip = lambda grv, ntg, phi, sw, bo: c * grv * ntg * phi * (1 - sw) / bo
det = ooip(grv_b, ntg_b, phi_b, sw_b, bo_b)
print(f"deterministic best estimate: {det / 1e6:.3f} {unit}")

n = 20000
trials = []
for _ in range(n):
    N = ooip(draw_grv(), draw_ntg(), draw_phi(), draw_sw(), draw_bo())
    rf_dep = tri(0.12, 0.34, 0.22)              # natural depletion with an uncertain aquifer
    rf_wf = tri(0.30, 0.45, 0.38)               # waterflood from the start
    trials.append((N, N * rf_dep, N * rf_wf))
def pct(vals, p):                                # P90 = value exceeded with 90 percent probability
    s = sorted(vals); return s[int((1 - p / 100) * (len(s) - 1))]
for i, name in enumerate(("oil in place", "recoverable, depletion", "recoverable, waterflood")):
    v = [t[i] for t in trials]
    print(f"{name:24s} P90 {pct(v, 90) / 1e6:6.3f}  P50 {pct(v, 50) / 1e6:6.3f}  P10 {pct(v, 10) / 1e6:6.3f}  mean {sum(v) / n / 1e6:6.3f}  ({unit})")
v = [t[0] for t in trials]
print(f"P10/P90 ratio for oil in place: {pct(v, 10) / pct(v, 90):.2f}")
# Which input matters most? Swing each input from its low to high value with the others at their best estimates.
swings = {"gross rock volume": (draw_grv, 0), "net-to-gross": (draw_ntg, 1), "porosity": (draw_phi, 2), "water saturation": (draw_sw, 3), "formation volume factor": (draw_bo, 4)}
base = [grv_b, ntg_b, phi_b, sw_b, bo_b]
for name, (draw, k) in swings.items():
    s = sorted(draw() for _ in range(4000)); lo, hi = s[400], s[3600]  # 10th and 90th percentiles of the input
    a = base.copy(); a[k] = lo; b = base.copy(); b[k] = hi
print(f"{name:24s} swing {abs(ooip(*b) - ooip(*a)) / 1e6:5.3f} {unit}")deterministic best estimate: 1.866 million m3 oil in place P90 1.505 P50 1.825 P10 2.211 mean 1.845 (million m3) recoverable, depletion P90 0.291 P50 0.410 P10 0.557 mean 0.418 (million m3) recoverable, waterflood P90 0.551 P50 0.686 P10 0.853 mean 0.695 (million m3) P10/P90 ratio for oil in place: 1.47 gross rock volume swing 0.498 million m3 net-to-gross swing 0.325 million m3 porosity swing 0.401 million m3 water saturation swing 0.121 million m3 formation volume factor swing 0.031 million m3
The P50 oil in place is 1.825 million m³, with P90 and P10 of 1.505 and 2.211 million m³: a P10/P90 ratio of 1.47, which is typical for a discovery with two wells and good 3D seismic. The P50 is 2 percent below the deterministic best estimate of 1.866 million m³, because the skewed water saturation distribution pulls the median down. The recoverable volumes show what the choice of recovery mechanism is worth: the P50 under depletion is 0.41 million m³, under waterflood 0.69 million m³. The waterflood P90, 0.55 million m³, is almost the same as the depletion P10 of 0.56 million m³. The swings show that gross rock volume dominates the uncertainty, followed by porosity and net-to-gross; water saturation and the formation volume factor matter little.
The tornado result has a direct practical use. If the team wants to narrow the range of oil in place, the data that would help most are those that reduce the gross rock volume uncertainty: another well on the flank, or a better velocity model. More porosity logs from the crest would barely change the range. That conclusion goes into the data acquisition plan as an argument for drilling the first development well where it also tests the flank structure.
Worked problem
Means, medians and adding up volumes
Daniel wants to report the total recoverable oil from Spruce Ridge and a small satellite structure to the north that may hold oil. For Spruce Ridge under waterflood, P50 = 0.686 and mean = 0.695 million m³; for the satellite, P50 = 0.05 and mean = 0.08 million m³ (it is very skewed). What is the expected total, and can he add the P50s?
Show solution
- Means add exactly, whatever the distributions: the expected total is the sum of the means.
- Expected total = 0.695 + 0.08 = 0.775 million m³.
- The P50 of the total is not 0.686 + 0.05 = 0.736; for independent skewed distributions it lies between the sum of the P50s and the sum of the means, and must be found by combining the distributions.
Answer: Add means, not P50s or P90s. Adding P90s understates the P90 of the total, because it requires every component to be low at once. Probabilistic aggregation should be done by simulation, or the components reported separately.
Classifying the volumes
Under COGEH and the Petroleum Resources Management System, Spruce Ridge's oil is a discovered accumulation, because wells have found it and tested it at commercial rates. But it cannot yet be booked as reserves. Reserves require a defined development project that is commercially justified, that the company intends to carry out, and that is reasonably expected to be approved and started within a reasonable time, normally five years. None of that exists yet: the development plan is what the team is writing. The recoverable volumes are therefore contingent resources, in the development pending subclass, because the contingencies, the choice of development option, sanction by the company and regulatory approval, are being actively resolved. Once Prairie Crest sanctions a plan, the volumes for that plan can move to reserves, divided into proved, probable and possible categories.
The classification is not a formality. Lenders do not lend against contingent resources, and the company's reported reserves will not include Spruce Ridge until the plan is approved. Daniel notes in the report that the choice of development option will also change the reserves that can be booked. A plan that relies on depletion would support smaller reserves, with more of the volume left as contingent resources awaiting a later waterflood decision.
The free water level as a hidden input
One input does not appear in the table of distributions, because it was fixed by the pressure data: the free water level. It is worth checking how much it matters. The reef's area at the free water level is about 131 hectares, so moving the level by 1 m changes the gross rock volume by about 1.3 million m³, or 2.6 percent. The pressure-derived level has an uncertainty of perhaps ±1.5 m, from the scatter of the gradient fits, which is small compared with the depth-conversion uncertainty at the flanks, and the team leaves it fixed. Had the supercharged test been kept, the level would have moved 19 m deeper and the gross rock volume would have grown by roughly half, far outside the range of any distribution in the table. That is the practical meaning of the data review in Lesson 2: some errors are not uncertainties to be sampled but mistakes to be removed before sampling begins.
Documenting the estimate
Graham Whitlock's first request when he reviews the volumetrics is for the documentation. He wants to see the maps and their versions, the log cutoffs and the wells used, the source and shape of every distribution and the reason for it, any dependencies included or ignored, the number of trials and the random seed, the results with the deterministic check, and the inputs that drive the range. An estimate that another engineer cannot reproduce from its documentation will not survive a reserves audit, however good the geology behind it. Connor writes a two-page volumetrics note in that form and attaches the code. It takes an afternoon, and it saves a week of questions when the sponsor's reserves group picks up the work in the define stage.
The note ends with the statement that matters most for the decision. Recoverable volume is far more sensitive to the recovery mechanism than to anything the volumetrics can resolve: the waterflood P50 is about two-thirds larger than the depletion P50, while the full P90 to P10 range of oil in place is about two-fifths of its P50 value. Whatever the geologists and petrophysicists do next, the development choice will matter more.
Common mistakes
MistakeUsing the scatter of individual log samples as the uncertainty in the pool-average porosity.
InsteadUse the uncertainty of the average, which is much narrower.
MistakeMultiplying all the low input values to get a P90.
InsteadCombine distributions by simulation; the product of lows is far less likely than 90 percent.
MistakeAdding P50s or P90s of several accumulations.
InsteadAdd means; aggregate other percentiles by simulation or report separately.
MistakeCalling a discovery's recoverable volumes reserves before a development project is sanctioned.
InsteadClassify them as contingent resources until the commerciality and approval conditions are met.
Summary and key terms
- Oil in place is gross rock volume times net-to-gross, porosity and oil saturation, divided by the formation volume factor.
- Input distributions must describe the uncertainty in pool averages and be justified from the data.
- Monte Carlo simulation combines the input distributions; P90, P50 and P10 are the values exceeded with 90, 50 and 10 percent probability.
- At Spruce Ridge, gross rock volume dominates the range of oil in place; the recovery mechanism dominates the range of recoverable oil.
- Means can be added; percentiles cannot.
- Until a development project is sanctioned, the recoverable volumes are contingent resources, development pending.
- P90, P50, P10
- Values with 90, 50 and 10 percent probability of being equalled or exceeded.
- Monte Carlo simulation
- Repeated random sampling of uncertain inputs to build the distribution of a result.
- Tornado analysis
- Ranking inputs by how much the result changes when each is moved across its range.
- Contingent resources
- Discovered recoverable quantities not yet considered commercial because of one or more contingencies.
- Development pending
- The contingent resources subclass for projects whose contingencies are being actively resolved.
Practice problems
Work each problem on paper first, then reveal the answer to check.
Why does the P50 oil in place fall below the deterministic best estimate at Spruce Ridge?
Show answer
The water saturation distribution is skewed toward high values, so the median oil saturation is lower than the most likely value.
Which data would most reduce the range of oil in place, and why?
Show answer
Data that constrain gross rock volume, such as a flank well or better velocities, because gross rock volume has the largest swing.
Two independent prospects have mean volumes of 2 and 5 units. What is the mean of the total?
Show answer
7 units.
What must happen before Spruce Ridge's volumes can be called reserves?
Show answer
A development project must be defined, judged commercial, committed to by the company and expected to be approved and started within a reasonable time.
Lesson quiz · 5 questions
Score 60% or more to complete this lesson.
Create a free account to save your progress, take quizzes and earn a certificate.