
PET-499 · Lesson 10 of 12 · 20 min
Economics and decision analysis
Daniel has spent the term building the economic model in parallel with the technical work, with placeholder numbers that are now being replaced by the team's forecasts and costs. In week 12 the model has to answer the committee's question: which option creates the most value for Prairie Crest, how sure can the company be of that value, and what could make the answer wrong? Diane Mercer, who leads reserves and planning at Prairie Crest, reviews the model with him, and Graham Whitlock of Kestrel Petroleum Consultants, the company's reserves evaluator, has agreed to sit on the panel at the design review.
The economic basis
An economic evaluation is only as good as its assumptions, and the first thing any reviewer asks for is the basis: prices, costs, fiscal terms, discounting conventions and what is included or excluded. Daniel sets it out in one table at the front of the economics chapter, so that anyone can see it, challenge it, and rerun the model with a different assumption.
| Item | Assumption |
|---|---|
| Oil price at the field | 500 Canadian dollars per m³ (about 79.50 per barrel), flat in real terms, from Prairie Crest's planning deck |
| Gas and liquids | 0.08 Canadian dollars per m³ of raw gas, net of sweetening, sulphur handling and transport |
| Operating cost | 1.8 million dollars per year fixed, 45 dollars per m³ of oil, 6 dollars per m³ of water handled |
| Royalty | Modernized Royalty Framework, simplified: 5 percent until revenue reaches the cost allowance (illustrative 6.0 million dollars per producer), then about 20 percent at this price |
| Income tax | 23 percent combined federal and Alberta rate; wells deducted at 30 percent and facilities at 25 percent declining balance; company is taxable |
| Discounting | Real terms, 10 percent, mid-year convention for production; capital at the time spent |
| Excluded | Discovery and appraisal wells, seismic and the extended test (sunk); corporate overhead |
| Abandonment | 0.5 million dollars per well plus 2.5 million for the facilities, at the end of life |
The royalty and tax terms are simplified, and the report says so. The actual royalty calculation works well by well, with each well's cost allowance depending on its depth and length, and the tax calculation would use the company's actual tax pools. For comparing options these simplifications are adequate, because they affect all options in the same way; for a sanction decision, the define-stage model will use the full terms. The assumption that the company is taxable matters: it means each dollar of deduction saves tax immediately against the company's other income, rather than being carried forward until Spruce Ridge itself makes a profit.
Cash flow and value for each option
For each option and aquifer case, the model takes the production forecast from Lesson 8, calculates revenue, royalties and operating costs year by year until the economic limit, when the field no longer covers its costs, and then adds the capital, the tax relief on it and the abandonment cost. It reports the net present value at 10 percent before and after tax, the internal rate of return, the payout time and the profit-to-investment ratio, defined here as the after-tax NPV10 divided by the discounted capital.
# After-tax economics of the three Spruce Ridge options, expected values over the aquifer cases, and the downside.
SI = True      # True: Canadian case (m3, Canadian dollars), False: US case (bbl, US dollars)
if SI:
    N, cap, qv, qh, gor = 1.825e6, 320.0, 90.0, 160.0, 150.0
    oil_p, gas_p = 500.0, 0.08                    # dollars per m3 of oil; net value per m3 of raw gas
    fixed, var, wat = 1.8e6, 45.0, 6.0            # dollars per year; per m3 oil; per m3 water
    tax, aband_w, aband_f = 0.23, 0.5e6, 2.5e6
    C_star, post = 6.0e6, 0.198                   # illustrative cost allowance per well; post-payout royalty rate
    capex = {"A": [(0.0, 11.6e6, 27.0e6)], "B": [(0.0, 32.4e6, 30.5e6)],   # (year, wells, facilities)
             "C": [(0.0, 17.8e6, 27.0e6)]}
    ph2_flood, ph2_strong = (1.5, 7.2e6, 4.0e6), (1.5, 0.0, 0.0)
else:
    N, cap, qv, qh, gor = 8.105e6, 1600.0, 450.0, 800.0, 900.0
    oil_p, gas_p = 59.0, 2.40e-3                  # dollars per bbl; net value per scf of raw gas
    fixed, var, wat = 1.5e6, 7.0, 1.0
    tax, aband_w, aband_f = 0.244, 0.35e6, 1.5e6
    capex = {"A": [(0.0, 10.4e6, 12.0e6)], "B": [(0.0, 26.4e6, 15.0e6)],
             "C": [(0.0, 14.4e6, 13.0e6)]}
    ph2_flood, ph2_strong = (1.5, 6.0e6, 3.0e6), (1.5, 0.0, 0.0)
RF = {"A": {"weak": 0.15, "matched": 0.25, "strong": 0.31}, "B": {"weak": 0.34, "matched": 0.35, "strong": 0.36},
      "C": {"weak": 0.32, "matched": 0.33, "strong": 0.345}}
wells = {"A": 3, "B": 5, "C": 5}
P_AQ = {"weak": 0.35, "matched": 0.45, "strong": 0.20}

def profile(opt, aq, Nf=1.0):                    # same model as Lesson 8
    eur = N * Nf * RF[opt][aq]; k = 0.28 if (opt == "A" and aq == "weak") else 0.20
    wmax = 0.40 if (opt == "A" and aq == "weak") else 0.85
    out, Np = [], 0.0
    for y in range(30):
        capy = 3 * qv if opt == "A" else cap if opt == "B" else 2 * qh + qv
        eur_y = N * Nf * 0.30 if (opt == "C" and y < 2) else eur
        q = min(min(capy, cap) * 365 * 0.95, k * (eur_y - Np))
        Np += q; wc = wmax * (Np / eur) ** 1.5
        out.append((q, q * wc / (1 - wc)))
    return out

def cashflow(opt, aq, Nf=1.0, price=1.0, cx=1.0):
    items = list(capex[opt])
    if opt == "C": items.append(ph2_strong if aq == "strong" else ph2_flood)
    rows, cum_rev = [], 0.0
    nprod = 3
    for y, (q, w) in enumerate(profile(opt, aq, Nf)):
        rev = q * oil_p * price + q * gor * gas_p * price
        if SI:                                    # 5 percent until revenue reaches the cost allowance, then post-payout rate
            below = max(0.0, min(rev, C_star * nprod - cum_rev)); roy = 0.05 * below + post * (rev - below); cum_rev += rev
        else:                                     # lease royalty, then production and extraction taxes on the remainder
            roy = rev * 0.1875 + rev * 0.8125 * 0.10
        opex = fixed + var * q + wat * w
        if rev - roy - opex <= 0: break
        rows.append((y + 0.5, rev - roy - opex))
    life = len(rows)
    # capital and tax relief (wells 30 percent and facilities 25 percent declining balance in Canada; expensed in the US)
    capital = [(t, -(wl + fc) * cx) for t, wl, fc in items]
    aband = [(life + 0.5, -(aband_w * wells[opt] + aband_f))]
    bt = rows + capital + aband
    shields = []
    for t0, wl, fc in items:
        if SI:
            for base, r in ((wl * cx, 0.30), (fc * cx, 0.25)):
                shields += [(int(t0) + yr + 1.0, tax * base * r * (1 - r) ** yr) for yr in range(30)]
        else:
            shields.append((t0 + 0.5, tax * (wl + fc) * cx))
    at = [(t, v * (1 - tax)) for t, v in rows] + capital + aband + shields
    return bt, at, life

npv = lambda fl, r=0.10: sum(v / (1 + r) ** t for t, v in fl)
def irr(fl):
    lo, hi = -0.5, 2.0
    for _ in range(80):
        mid = (lo + hi) / 2
        lo, hi = (mid, hi) if npv(fl, mid) > 0 else (lo, mid)
    return mid
def payout(fl):
    cum = 0.0
    for t, v in sorted(fl):
        cum += v
        if cum >= 0 and t > 0.4: return t
    return None

print(f"{'option':8s} {'NPV10 BT':>9s} {'NPV10 AT':>9s} {'IRR AT':>7s} {'payout':>7s} {'PIR':>5s}  (history-matched aquifer, millions)")
emv = {}
for opt in "ABC":
    bt, at, life = cashflow(opt, "matched")
    inv = sum(-v / 1.1 ** t for t, v in bt if v < 0 and t < 2)
    print(f"{opt:8s} {npv(bt) / 1e6:9.1f} {npv(at) / 1e6:9.1f} {100 * irr(at):6.0f}% {payout(at):6.1f}y {npv(at) / inv:5.2f}   life {life} years")
    emv[opt] = sum(P_AQ[a] * npv(cashflow(opt, a)[1]) for a in P_AQ)
print("expected NPV10 AT over the aquifer cases: " + ", ".join(f"{o} {v / 1e6:.1f}" for o, v in emv.items()))
for opt in "ABC":
    vals = [npv(cashflow(opt, a)[1]) / 1e6 for a in ("weak", "matched", "strong")]
    print(f"   {opt}: weak {vals[0]:.1f}, matched {vals[1]:.1f}, strong {vals[2]:.1f}")
print("downside and sensitivities, NPV10 AT (matched aquifer):")
for label, kw in (("P90 oil in place", dict(Nf=0.825)), ("price -25 percent", dict(price=0.75)), ("capital +25 percent", dict(cx=1.25))):
print(f" {label:20s} " + ", ".join(f"{o} {npv(cashflow(o, 'matched', **kw)[1]) / 1e6:.1f}" for o in "ABC"))option NPV10 BT NPV10 AT IRR AT payout PIR (history-matched aquifer, millions) A 63.1 45.9 70% 1.5y 1.19 life 13 years B 82.4 59.3 51% 1.5y 0.94 life 15 years C 81.2 58.9 66% 1.5y 1.08 life 15 years expected NPV10 AT over the aquifer cases: A 39.9, B 58.8, C 60.4 A: weak 17.9, matched 45.9, strong 65.2 B: weak 56.1, matched 59.3, strong 62.5 C: weak 56.0, matched 58.9, strong 71.2 downside and sensitivities, NPV10 AT (matched aquifer): P90 oil in place A 30.4, B 39.2, C 38.8 price -25 percent A 21.0, B 24.6, C 26.3 capital +25 percent A 37.8, B 46.2, C 47.6
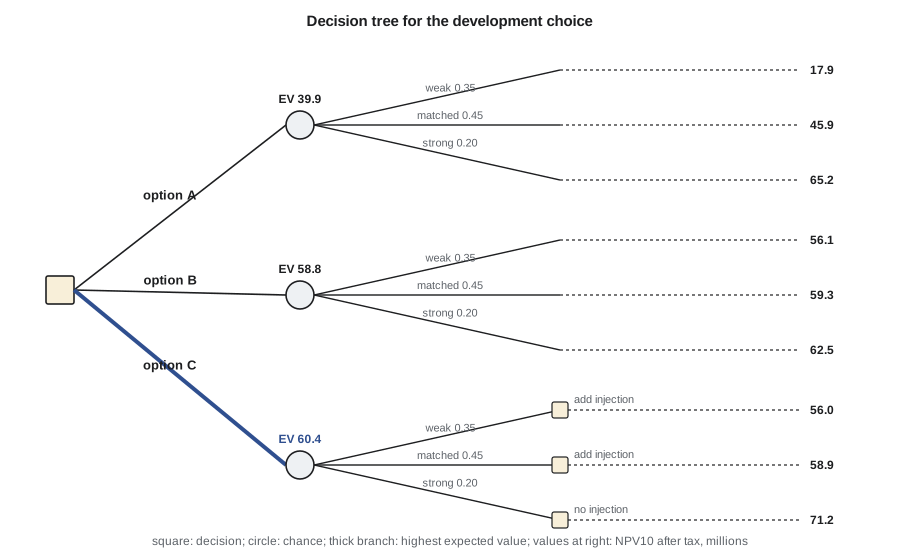
With the history-matched aquifer, all three options are strongly economic. Option B has the highest after-tax NPV10, 59.3 million dollars, but option C is only 0.4 million behind with 18 million dollars less initial capital, a higher internal rate of return of 66 percent and a higher profit-to-investment ratio. Option A has the best capital efficiency of all, but 13 million dollars less value. The expected values over the three aquifer cases, weighted 0.35, 0.45 and 0.20, change the order at the top: option C, 60.4 million dollars, is now ahead of option B, 58.8 million, because in the strong-aquifer case it avoids the cost of injection and is worth 71.2 million. Option A's expected value, 39.9 million, is well behind, because its weak-aquifer case is worth only 17.9 million.
The value of flexibility
Option C is a real option in the sense used in finance: it gives the company the right, but not the obligation, to invest in injection later, after it has learned something. Its value comes from the ability to avoid a bad investment rather than from any better geology or engineering. The value of that flexibility is the difference between the expected value of the flexible option and that of the best rigid one. The decision tree makes it visible. In option B the company commits to injection now, whatever the aquifer turns out to be. In option C it waits 18 months, observes the pressure, and invests only if injection is needed.
Worked problem
How much would perfect knowledge of the aquifer be worth?
Suppose a perfect test could reveal the aquifer case before the company chooses an option. Using the NPVs from the output, find the expected value with perfect information and compare it with the best expected value without it.
Show solution
- Weak aquifer: best option is B at 56.1 million (C is 56.0). Matched: B at 59.3 million. Strong: C at 71.2 million.
- Expected value with perfect information = 0.35 × 56.1 + 0.45 × 59.3 + 0.20 × 71.2 = 60.6 million dollars.
- The best choice without the information is option C, with an expected value of 60.4 million.
Answer: Perfect information about the aquifer would be worth only about 0.2 million dollars. The reason is that option C already captures almost all of its value: by waiting to see the aquifer before investing in injection, the company gets nearly the same result as if it had known in advance. Information is valuable only when it can change a decision, and option C leaves very little decision to change.
That result answers a question Ethan had asked in week 6: should the company run a longer production test before deciding anything? With option C available, no. The development itself is the test. The permanent pressure gauge in the 06-09 well, recommended in Lesson 2, is what makes option C work: it provides the pressure history on which the phase 2 decision will be made, at a cost of a few tens of thousands of dollars.
The downside
Expected value is the right basis for a company that undertakes many projects, but a development committee also wants to know what happens if things go badly. The last part of the output tests three downside cases with the history-matched aquifer: oil in place at the P90 value from Lesson 5, a price 25 percent lower for the life of the field, and capital 25 percent above the estimate, the upper part of the class 4 accuracy range.
Every option stays positive in every downside case. The P90 oil in place reduces option C's value to 38.8 million dollars; a 25 percent lower price reduces it to 26.3 million; a 25 percent capital overrun to 47.6 million. In each case option C remains first or a very close second. The Canadian Spruce Ridge project is robust: the reef is prolific, the wells are few and the capital is small relative to the reserves. The main risks are not economic but executional: drilling sour horizontal wells to the planned standoff, building the pipelines on schedule and getting the approvals.
Risk, return and the choice
The economics give a clear answer in Canada. Option C has the highest expected value, the second-highest base-case value by a negligible margin, a higher return on capital than option B, and the same robustness to the downside. Its only disadvantage is that, if the aquifer is weak, injection starts later and the field recovers slightly less. The value of that loss is included in its weak-case NPV, which is almost exactly the same as option B's. Daniel's recommendation to the team is option C.
Daniel also checks the indicators against each other. The internal rate of return favours low-capital options, because it measures return per dollar rather than total value created; ranking by IRR alone would push the company towards option A and leave value in the ground. Payout favours options that produce quickly but says nothing about what happens afterwards. The NPV, expected over the uncertain cases and tested on the downside, is the measure that answers the committee's question. The other indicators describe the shape of the investment and are reported alongside it.
Common mistakes
MistakeRanking options by internal rate of return.
InsteadRank by expected NPV at the company's discount rate; use IRR, payout and PIR to describe the investment.
MistakeValuing a phased option as if the second phase were always carried out.
InsteadValue the decision at each branch; flexibility has value only because the second phase may not be needed.
MistakePaying for information that cannot change the decision.
InsteadCalculate the value of information first; with a flexible option it is often small.
MistakeReporting only the base case.
InsteadShow expected values over the uncertain cases and the downside cases the committee cares about.
Summary and key terms
- The economic basis, including prices, costs, fiscal terms, discounting and exclusions, must be stated explicitly and applied equally to all options.
- Sunk costs are excluded; the company's tax position affects the value of deductions.
- Expected NPV over weighted cases is the main measure of value; IRR, payout and PIR describe the investment's shape.
- A phased option is a real option whose value comes from avoiding unnecessary investment.
- The value of information is the gain from being able to change a decision; a flexible option can make it nearly zero.
- Downside cases at low volumes, low prices and high costs show how much margin a project has.
- Expected monetary value (EMV)
- The probability-weighted average of the values of the possible outcomes.
- Profit-to-investment ratio (PIR)
- NPV divided by discounted capital, a measure of capital efficiency.
- Payout
- The time for cumulative net cash flow to recover the capital.
- Real option
- The right, but not the obligation, to make a later investment decision after learning more.
- Value of perfect information
- The increase in expected value from knowing an uncertain outcome before deciding.
- Economic limit
- The point at which a field's revenue no longer covers its operating costs.
Practice problems
Work each problem on paper first, then reveal the answer to check.
Why are the discovery and appraisal wells excluded from the option comparison?
Show answer
They are sunk costs, the same whatever option is chosen.
Why might IRR favour option A even though it creates less value?
Show answer
IRR measures return per dollar invested, and option A uses the least capital.
What is the source of option C's advantage over option B?
Show answer
It avoids the cost of injection if the aquifer proves strong, while losing little if injection is needed.
When is information worth paying for?
Show answer
When it could change the decision and the expected gain exceeds its cost.
Lesson quiz · 5 questions
Score 60% or more to complete this lesson.
Create a free account to save your progress, take quizzes and earn a certificate.