
PET-370 · Lesson 12 of 12 · 19 min
Development plan and economics: capstone
Ethan's year in the thermal group ends with the assignment Mei Lin promised at the start: a development plan for the next phase at Wapiti Lake. The north part of the lease holds bitumen that the first phase never reached, and the board wants to know whether a 5,000 m³/d (about 31,000 bbl/d) expansion is worth building. 'Pull together everything you have learned,' Mei says. 'Reservoir, wells, steam, water, carbon, regulation and money. Paul, Lena and Tom will review it. Then the board decides.'
This capstone lesson walks through the structure of a thermal development plan: the resource and process choice, the development concept, the production and steam forecast, the facility and water plan, the environmental and regulatory case, the cost estimate and the economics. It ends with the questions reviewers ask and the ways a plan can be made more robust.
Step 1: the resource
Ethan starts with the geology from lesson 2. Grace Nakoochee's mapping shows a continuous McMurray channel sand in the north of the lease, with 20 to 35 m of pay at bitumen saturations of 0.65 to 0.75 and a thin, discontinuous mud layer near the middle in some areas. The Clearwater shale cap rock is continuous and has been tested for the planned operating pressure. There is a thin water zone at the top in the eastern part of the area, which Ethan flags as a risk. Using the volumetric method from lesson 1, the area holds about 85 million m³ of bitumen in place.
Step 2: the process and concept
The choice of process follows from the reservoir. The pay is thick, the bitumen is immobile at reservoir temperature and the cap rock is sound, so SAGD is the base case. Ethan considers solvent-assisted SAGD as an option: it would lower the SOR and carbon cost but needs a reliable supply of condensate and good solvent recovery. CSS is ruled out by the shallow depth and containment rules, and mining by the depth of overburden.
The development concept is ten pads of eight well pairs, each pair about 900 m long and 100 m from its neighbours, drilled in three phases. A central processing facility with steam generators, water treatment and oil treating serves all the pads, with room for later expansion. Sustaining well pairs are drilled every year after start-up to replace declining production.
Step 3: production and steam forecast
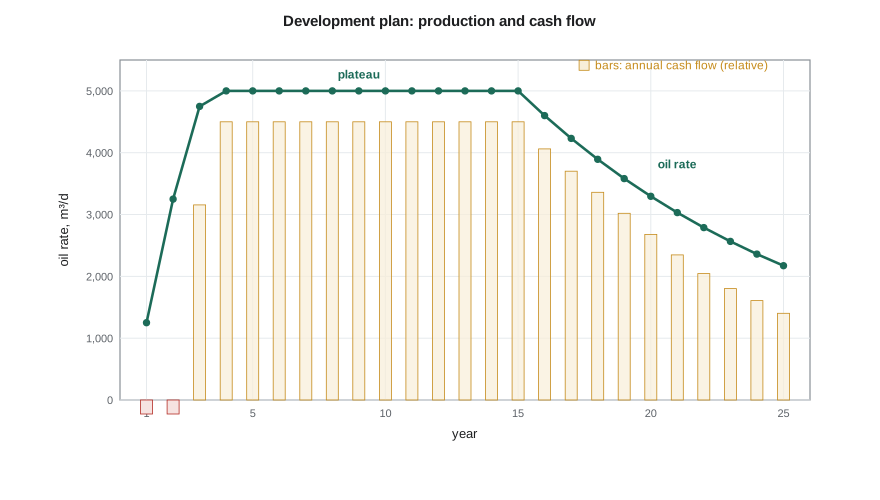
Butler's equation from lesson 5, scaled by an efficiency factor from the field's history, gives a rate per well pair. Combining it with the drilling schedule gives a field forecast: a ramp over three years, a plateau of 5,000 m³/d for about twelve years and a decline at about 8 percent a year as chambers merge. Over 25 years the plan recovers about 37 million m³, about 44 percent of the bitumen in place, at an average SOR of 3.0.
Step 4: facilities, water and emissions
The steam rate at plateau is about 15,000 m³/d CWE. The water plan, following Directive 081, recycles about 90 percent of the produced water, with make-up from a deep saline aquifer and blowdown handled by an evaporator. The greenhouse gas intensity, using the method from lesson 11, is about 470 kg CO₂e per m³ at an SOR of 3, close to the facility benchmark, so the carbon compliance cost is moderate. Ethan includes a case with solvent co-injection, which brings the SOR down to about 2.5, and notes the potential to connect to a regional carbon capture network if one is built.
Step 5: costs and economics
The economic model brings the pieces together. Revenue is the production times the netback price, which is the market price less transport, blending and other deductions. Operating costs include steam, at a cost per unit of steam that depends mainly on gas price, fixed costs for the facility and staff, and carbon compliance costs. Capital costs include the initial facility and wells over three years and sustaining capital every year. The net present value, NPV, discounts each year's cash flow to today at the company's discount rate.
# Development economics for a thermal project: production, steam, carbon and NPV
SI = True
years = 25
peak = 5000.0 if SI else 10000.0          # m3/d bitumen (ca SAGD expansion) or bbl/d (us steamflood expansion)
ramp = [0.25, 0.65, 0.95] + [1.0] * 12 + [0.92 ** n for n in range(1, years - 14)]
sor = 3.0 if SI else 4.0
price = 380.0 if SI else 62.0              # netback per m3 (CA dollars) or per bbl (US dollars) before steam and carbon costs
steam_cost = 22.0 if SI else 1.9           # gas and water cost per m3 or per bbl of steam (CWE)
carbon = 6.0 if SI else 1.2                # net carbon compliance cost per m3 or per bbl of oil
opex_fixed = 60e6 if SI else 45e6          # per year
capex = [450e6, 550e6, 150e6] if SI else [180e6, 140e6, 60e6]
sustaining = 40e6 if SI else 25e6          # new well pairs or patterns each year after start-up
r = 0.10
npv = 0.0; cum = 0.0
for y in range(years):
    oil = peak * ramp[y] * 365
    cash = oil * (price - sor * steam_cost - carbon) - opex_fixed - (sustaining if y >= 3 else 0)
    cash -= capex[y] if y < len(capex) else 0
    npv += cash / (1 + r) ** (y + 0.5)
    cum += oil
    if y in (0, 2, 5, 10, 15, 20, 24):
        print(f"year {y + 1:2d}: oil {peak * ramp[y]:7,.0f} {'m3/d' if SI else 'bbl/d'}  cash flow {cash / 1e6:7.0f} million")
print(f"cumulative oil {cum / 1e6:.0f} million {'m3' if SI else 'bbl'}; NPV at 10 % = {npv / 1e6:,.0f} million")
for d_sor in (-0.5, 0.5):
    npv2 = 0.0
    for y in range(years):
        oil = peak * ramp[y] * 365
        cash = oil * (price - (sor + d_sor) * steam_cost - carbon) - opex_fixed - (sustaining if y >= 3 else 0) - (capex[y] if y < len(capex) else 0)
        npv2 += cash / (1 + r) ** (y + 0.5)
print(f"SOR {sor + d_sor:.1f}: NPV {npv2 / 1e6:,.0f} million")year 1: oil 1,250 m3/d cash flow -369 million year 3: oil 4,750 m3/d cash flow 324 million year 6: oil 5,000 m3/d cash flow 462 million year 11: oil 5,000 m3/d cash flow 462 million year 16: oil 4,600 m3/d cash flow 417 million year 21: oil 3,032 m3/d cash flow 241 million year 25: oil 2,172 m3/d cash flow 144 million cumulative oil 37 million m3; NPV at 10 % = 2,618 million SOR 2.5: NPV 2,779 million SOR 3.5: NPV 2,458 million
The base case gives an NPV of about 2.6 billion dollars at 10 percent. Mei Lin looks at the sensitivity first. 'Half a point of SOR moves the value by about 160 million dollars either way,' she says. 'What about price?' Ethan has run that too: a 20 percent drop in the netback, which is well within the range of the last decade, cuts the NPV by more than 40 percent. 'So the reservoir decides how good the project is,' Mei says, 'and the market decides how good it looks. Make sure the board sees both.'
Step 6: risks and the review
Paul, Lena and Tom each review the plan from their own angle. Paul asks about the reservoir: are the pay and saturation maps supported by enough wells and core, and how much would the mud layer or the top water reduce the rate? Lena asks about the forecast: does the efficiency factor match the field's history, and what happens if the plateau is shorter? Tom asks about operations: can the steam generators and water plant reach the planned capacity, and how will start-up of new wells be managed alongside existing ones? Mei asks about the decision: which uncertainties matter most, what would it take to change the recommendation and what can be learned before the money is committed?
Ethan answers with a risk register that lists each uncertainty, its likely effect on value and the way it will be managed: more delineation wells where the pay map is weakest, a phased development so that the first phase informs the later ones, a solvent pilot before committing to solvent co-injection, and a range of price cases. The plan does not remove the uncertainties, but it shows the board what they are and how the company will respond.
Bringing the course together
The capstone draws on every lesson. The classification of heavy oil and bitumen and the volumetric estimate come from lesson 1, the geology and containment from lesson 2 and the viscosity and thermal properties from lesson 3. Steam generation, mining and extraction and wellbore heat losses come from lesson 4, the SAGD concept and Butler's equation from lesson 5 and operations and SOR from lesson 6. Cyclic steam, steamflooding and the alternatives to steam come from lessons 7 to 10, and the environmental and regulatory case from lesson 11. A good thermal engineer knows how each of these pieces connects to the others, and to the value of the project.
Worked problem
NPV of a simple cash flow
A small expansion costs 300 million dollars now and earns 60 million dollars a year for ten years, starting at the end of year 1. Calculate the NPV at 10 percent.
Show solution
- The present value factor for ten equal annual payments at 10 percent is (1 − 1.1⁻¹⁰) / 0.1 = 6.145.
- PV of the cash flows = 60 × 6.145 = 368.7 million dollars.
- NPV = 368.7 − 300 = 68.7 million dollars.
Answer: About 69 million dollars. The project creates value at a 10 percent discount rate, but a 20 percent drop in annual cash flow would make the NPV negative.
Presenting the plan
The final step is presenting the plan to the people who decide. A board does not need every calculation, but it does need a clear account of what is proposed, what it will cost, what it is expected to return and what could go wrong. Ethan organises his presentation around a few key exhibits: a map showing where the development would go and why, a production and steam forecast with its range of uncertainty, a cash flow chart with the base case and the main sensitivities, a summary of the environmental case and the permits needed, and the risk register. Each exhibit has a one-line conclusion at the top so that the message is clear even to someone who reads only the headlines.
Mei Lin adds advice from her own experience. Show the downside honestly, because a board that is surprised later loses trust in the team. Explain what the company will learn from each phase and how that learning will change later decisions. And state the recommendation plainly: proceed, proceed with conditions, or stop. A plan that ends with a clear recommendation, supported by the analysis and honest about its uncertainties, is far more useful than one that hedges every statement.
After the decision
Approval starts a new phase of work. Regulatory applications are prepared from the plan, detailed engineering of the facilities begins, drilling programs are designed and contracts are let. The forecast becomes the baseline against which the project's performance will be tracked. As the first wells come on, engineers compare actual rates and SORs with the forecast and update the reservoir model, which informs the later phases. In this way a development plan is never really finished: it is revised with each new set of data, and the questions it answers, which process, how many wells, how much steam, at what cost and with what impact, are asked again at every stage of the project's life.
For Ethan, the year in the thermal group has been an introduction to all of these questions. He has learned how heavy oil and bitumen differ from conventional oil, why heat and solvents work and where they fall short, how to estimate rates and steam needs with simple models and when to trust those models, and how environmental and economic factors shape every decision. The skills apply far beyond a single asset, to any project in which energy, fluids and rock must be managed together.
Common mistakes
MistakeBuilding the plan around one process without checking the reservoir.
InsteadLet thickness, viscosity, depth and cap rock decide the process.
MistakeUsing Butler or Marx-Langenheim rates unscaled.
InsteadCalibrate analytical forecasts to field history or simulation.
MistakePresenting a single NPV.
InsteadShow sensitivities to SOR, price and costs, and the main risks.
MistakeLeaving environmental and regulatory costs out of the economics.
InsteadInclude carbon, water and reclamation costs and the permitting path.
Summary and key terms
- A thermal development plan starts with the resource and lets the reservoir choose the process.
- The concept sets wells, pads or patterns, facilities and phasing.
- Analytical models calibrated to field history give production and steam forecasts.
- Water, emissions and regulation are part of the plan and the economics.
- NPV discounts cash flows; SOR and price sensitivities show what matters.
- A risk register and phased development make the plan robust.
- Development plan
- A document setting out how a resource will be developed, produced and paid for.
- Netback
- Market price less transport, blending and other deductions.
- NPV
- Net present value, the sum of discounted cash flows.
- Sustaining capital
- Spending on new wells and equipment to maintain production.
- Sensitivity
- The change in value for a change in one input.
- Risk register
- A list of uncertainties, their effects and how each will be managed.
Practice problems
Work each problem on paper first, then reveal the answer to check.
What decides the choice of process?
Show answer
Reservoir thickness, viscosity, depth and cap rock.
Why calibrate analytical rates?
Show answer
Ideal models overestimate field performance.
What is a netback?
Show answer
The price received after transport and other deductions.
How can phasing reduce risk?
Show answer
The first phase provides information before later spending.
Lesson quiz · 5 questions
Score 60% or more to complete this lesson.
Create a free account to save your progress, take quizzes and earn a certificate.