
PET-370 · Lesson 2 of 12 · 19 min
Geology of the Athabasca oil sands
Paul's first assignment for Ethan is to understand what the Wapiti Lake wells are actually draining. 'In SAGD, geology is destiny,' he says. 'Two well pairs that look identical on paper can have steam-oil ratios that differ by a factor of two because one of them sits under a mud layer we did not map.' Ethan spends his first weeks with the geologist, Grace Nakoochee, going through core photographs, logs and seismic from the lease.
This lesson describes the deposits the asset produces from: the McMurray Formation of the Athabasca oil sands, how it was laid down, why it is so rich and why it is so variable. It then covers the cap rock that keeps the steam in, the water and gas zones that can steal heat, and how core and logs are used to define net pay for an in situ project.
A giant deposit at the edge of a basin
The Athabasca deposit lies in northeastern Alberta at the eastern edge of the Western Canada Sedimentary Basin. Oil generated in deeply buried source rocks to the west migrated up-dip, eastward, over long distances. Near the eastern edge of the basin it reached shallow, porous sands of the Lower Cretaceous McMurray Formation, where it was trapped beneath shales and biodegraded into bitumen. The McMurray rests on an eroded surface of much older Devonian carbonates, and its thickness varies with the relief of that surface. In the mineable area north of Fort McMurray, the formation crops out along the Athabasca River and lies within a few tens of metres of the surface. Southward and westward it dips to depths of several hundred metres, where it must be produced in situ.
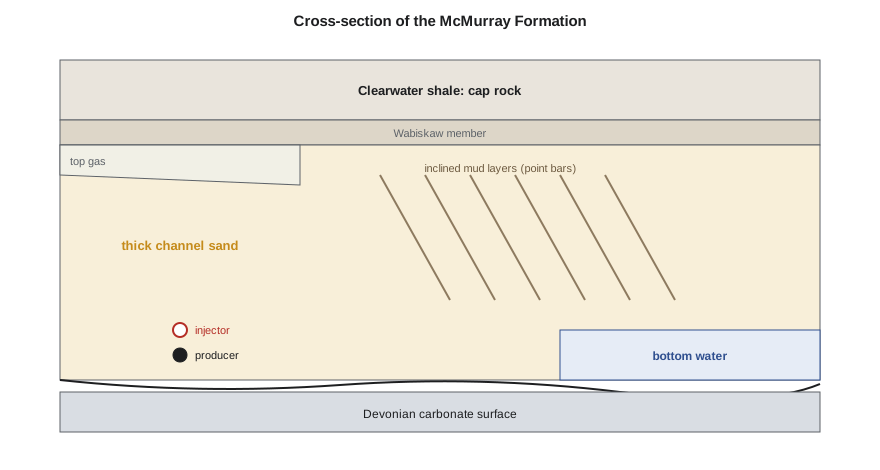
The McMurray was deposited about 110 to 120 million years ago, when rivers flowing from the south and east emptied into a seaway advancing from the north. The lower part is mostly fluvial, laid down by rivers. The middle and upper parts are mostly estuarine, deposited where the rivers met tidal water. The result is a complex of stacked channel sands, point bars, abandoned channels filled with mud, and tidal flats. Clean channel sands can be tens of metres thick and extraordinarily rich, while the point bars contain inclined beds of sand and mud known as inclined heterolithic stratification, or IHS.
Why the sands are so rich
The McMurray sands are mostly fine to medium quartz grains that were never deeply buried, so they are uncemented and unusually porous. Porosity in clean sands is commonly 30 to 35 percent and permeability several darcies. Bitumen fills most of the pore space: oil saturations of 70 to 85 percent are common in the best channel sands. The rest is water, and an important feature of the Athabasca deposit is that the grains are thought to be water-wet, with a thin film of water around each grain separating it from the bitumen. That water film is what makes the hot-water extraction process of lesson 4 possible.
Oil sands richness is usually reported as bitumen weight percent, the mass of bitumen per mass of oil sand, measured on core by the Dean-Stark method. Rich ore has 12 to 15 weight percent bitumen. Converting weight fractions to porosity and saturation requires the densities of the grains, bitumen and water, which is what the code in this lesson does. For in situ projects, a common net pay cutoff is about 6 weight percent bitumen, together with porosity and shale-volume cutoffs from logs, as in PET-350.
Mud layers, bottom water and top gas
Three geological features decide much of a SAGD project's performance. The first is mud. Inclined mud layers in point bars, and thick mud plugs in abandoned channels, slow or block the rise of the steam chamber. A continuous mud layer a few metres above the well pair can cap a chamber early and leave the bitumen above it unrecovered. The second is bottom water. Where the McMurray sits on a water-saturated sand, the steam chamber can lose heat to the water, and the producer must be placed far enough above it to avoid drawing water in. The third is top gas or a top water zone, sometimes called a thief zone. If the steam chamber reaches a gas zone at the top of the deposit, it can lose pressure and heat into it. In the early 2000s, gas production from such zones above some oil sands leases became a regulatory dispute because depleting the gas could ruin future SAGD recovery.
The cap rock matters as much as the reservoir. Over most of the Athabasca in situ area, the McMurray is overlain by shales of the Wabiskaw and Clearwater formations. If steam pressure exceeds what the cap rock can withstand, steam can break through to shallow aquifers or the surface. In 2006, a steam release at a SAGD project in the shallow Athabasca area blew out a crater at the surface, and the regulator responded with stricter cap rock requirements for shallow projects. Those requirements, once a separate directive, are now part of the the AER's Directive 023 on oil sands project applications, which sets out what an operator must show about reservoir containment before steaming.
From core and logs to a development map
The development team turns the geology into numbers that a plan can use: maps of net pay, oil saturation, porosity, the depth to the base of the pay and the distance to any water or gas, and the location and continuity of shale or clay layers. These maps decide where well pairs or patterns go and how they are spaced. Delineation drilling on thermal leases is dense compared with conventional pools: an oil sands lease may have a vertical core hole every few hundred metres, and 3D seismic is used to map channel edges and mud plugs. On mature California leases, decades of well logs and temperature surveys provide the same kind of detail.
# From core: bitumen mass fraction to oil saturation, and net pay with a cutoff
SI = True
rho_s, rho_o, rho_w = 2.65, 1.01, 1.00     # g/cm3 for quartz grains, oil and water
def saturations(wb, ww):
    # wb, ww: weight fractions of oil and water in the core sample; the rest is solids
    ws = 1.0 - wb - ww
    vs, vo, vw = ws / rho_s, wb / rho_o, ww / rho_w
    phi = (vo + vw) / (vs + vo + vw)
    return phi, vo / (vo + vw)
if SI: core = [(0.5, 0.135, 0.030), (1.5, 0.140, 0.028), (2.5, 0.120, 0.040), (3.5, 0.060, 0.090), (4.5, 0.115, 0.045), (5.5, 0.025, 0.150)]
else:  core = [(2.0, 0.135, 0.030), (5.0, 0.140, 0.028), (8.0, 0.120, 0.040), (11.0, 0.060, 0.090), (14.0, 0.115, 0.045), (17.0, 0.025, 0.150)]
step = 1.0 if SI else 3.0
cut = 0.06                     # 6 % bitumen by weight is a common net-pay cutoff for in situ projects
net = 0.0
unit = "m" if SI else "ft"
for depth, wb, ww in core:
    phi, so = saturations(wb, ww)
    pay = wb >= cut
    if pay: net += step
    print(f"{depth:5.1f} {unit} below top  oil {wb:5.1%} wt  porosity {phi:.2f}  So {so:.2f}  {'pay' if pay else 'not pay'}")
print(f"net pay in this {len(core) * step:.0f} {unit} interval: {net:.0f} {unit}")0.5 m below top oil 13.5% wt porosity 0.34 So 0.82 pay 1.5 m below top oil 14.0% wt porosity 0.35 So 0.83 pay 2.5 m below top oil 12.0% wt porosity 0.33 So 0.75 pay 3.5 m below top oil 6.0% wt porosity 0.32 So 0.40 pay 4.5 m below top oil 11.5% wt porosity 0.33 So 0.72 pay 5.5 m below top oil 2.5% wt porosity 0.36 So 0.14 not pay net pay in this 6 m interval: 5 m
Ethan's core interval shows the pattern Grace expected: a rich channel sand with a leaner layer in the middle and water-wet, lean sand at the base. The 3.5 m sample is just at the cutoff. 'That middle layer will not stop steam, but it will slow it,' Grace says. 'If it were mud rather than lean sand, we would worry more.'
Worked problem
Bitumen in place per hectare
A section of lease has 22 m of net pay with porosity 0.33 and bitumen saturation 0.78. How much bitumen is in place per hectare?
Show solution
- One hectare is 10,000 m².
- N = A h φ S_o = 10,000 × 22 × 0.33 × 0.78.
- N ≈ 56,600 m³ per hectare.
Answer: About 57,000 m³ (about 356,000 barrels) of bitumen per hectare. A 100-hectare development area therefore holds about 5.7 million cubic metres.
Seismic, delineation and the reservoir model
Core holes give exact information at points, but the space between them must be filled. In the oil sands, operators drill delineation wells at a density that regulators specify for in situ approvals, typically several wells per section in the area of a planned pad, and acquire 3D seismic surveys across the whole development area. The seismic data show the shape of channels, the extent of mud-filled abandoned channels and the top of the McMurray Formation, which helps place well pairs where the pay is thickest and cleanest. Geologists combine core descriptions, logs and seismic attributes into a 3D geological model, in which each cell carries a facies, porosity, permeability and bitumen saturation. That model is the input to thermal simulation and to the volumetric estimates the regulator reviews.
Uncertainty in the model is handled by building several realisations, each consistent with the data but different between wells. Running the forecast on several realisations shows how much the predicted rate or SOR could vary, and where an extra well would reduce that uncertainty most. That is the starting point of the risk register in lesson 12.
Testing the cap rock
Before steam is injected, the strength of the cap rock and the stress in the ground above the reservoir must be known. Operators run small injection tests, called mini-frac or step-rate tests, in the cap rock and the reservoir, pumping fluid until the rock fractures and measuring the pressure at which fractures open and close. Core samples of the Clearwater shale are tested in the laboratory for strength, permeability and how they respond to heating. Geomechanical models then predict how the reservoir and cap rock will expand, how stresses will change as the steam chamber grows and what maximum operating pressure keeps a safety margin below fracture. In the shallow part of the Athabasca area, AER Directive 086 sets out what this containment case must include, and the approved maximum operating pressure becomes a condition of the project licence.
Containment work does not end with approval. Observation wells, surface heave monitoring and pressure surveillance continue for the life of the project, and any sign that steam or fluids are moving out of the target zone triggers investigation and, if necessary, lower injection pressures or a halt to steaming in the area.
Water, gas and other zones
The geologist also maps everything above and below the pay that could interact with steam. Water-bearing sands below the reservoir may supply bottom water that floods a chamber; water or gas zones above it may act as thief zones that drain heat and pressure; freshwater aquifers higher in the section must be protected. Old wells that penetrate the reservoir are another potential pathway, so their locations and condition are reviewed, and any that are not designed for thermal temperatures are repaired or replugged before steam reaches them. This inventory of zones and pathways is part of the application a regulator reviews before approving steam injection.
The result of all this work is a set of maps and models that the reservoir engineers, drilling engineers and regulators all rely on. The better they are, the better the wells are placed, the lower the steam-oil ratio and the more confident everyone can be that the steam will stay where it belongs.
Common mistakes
MistakeAssuming a thick sand is continuous between wells.
InsteadMap mud or clay layers and channel edges with dense drilling and seismic before placing wells.
MistakeIgnoring the cap rock or overlying zones.
InsteadShow containment and keep injection pressure below the fracture limits of the cap rock.
MistakeUsing porosity cutoffs alone for net pay.
InsteadCombine oil content, porosity and shale or clay volume.
MistakeTreating unconsolidated core like hard rock core.
InsteadPreserve or freeze core and account for sand control in the wells.
Summary and key terms
- The McMurray Formation is a Lower Cretaceous fluvial-estuarine sand at the eastern edge of the basin.
- Clean channel sands have about 30 to 35 percent porosity, darcies of permeability and 70 to 85 percent bitumen saturation.
- Inclined mud layers, mud plugs, bottom water and top gas or water zones control steam chamber growth.
- Cap rock containment requirements for shallow projects are now part of Directive 023.
- Richness is measured as bitumen weight percent; about 6 weight percent is a common in situ cutoff.
- Dense delineation drilling and 3D seismic map where well pairs can go.
- McMurray Formation
- The Lower Cretaceous sand that holds most of the Athabasca bitumen.
- Inclined heterolithic stratification (IHS)
- Inclined interbeds of sand and mud formed on point bars.
- Mud plug
- An abandoned channel filled with mud that can block steam.
- Cap rock
- The low-permeability layer above the reservoir that contains the steam.
- Thief zone
- A gas or water zone that can take heat or pressure from a steam chamber.
- Dean-Stark analysis
- A laboratory method that measures oil, water and solids in a core sample.
Practice problems
Work each problem on paper first, then reveal the answer to check.
Why is it important that the reservoir sands are water-wet?
Show answer
The water film around the grains lets hot water and steam release the oil from the sand.
What happens if a steam zone meets a continuous shale or clay layer?
Show answer
It spreads beneath it, and the oil above is not reached until the layer is breached or steamed separately.
Why are injection pressures limited?
Show answer
To avoid fracturing the reservoir and cap rock and creating paths to aquifers or the surface.
What does a 6 weight percent cutoff mean?
Show answer
Samples with less than 6 percent oil by weight are not counted as net pay.
Lesson quiz · 5 questions
Score 60% or more to complete this lesson.
Create a free account to save your progress, take quizzes and earn a certificate.