
MBA-504 · Lesson 1 of 12 · 21 min
Thinking with data as a manager
Data Analysis for Managers is the fourth course in the first term of the weekend executive MBA at the Lakeshore School of Business in Toronto. It is taught by Dr. Mei-Ling Zhou, a statistician who led analytics teams at a national bank and at an airline before she moved into teaching. She starts the first Friday session by putting a single slide on the screen. It shows a dashboard with forty coloured tiles, each one green, amber or red, and she asks the five managers in the room a simple question: which decision would you make differently tomorrow because of this screen? Nobody can name one. That, she says, is the problem this course is meant to solve.
The cohort is the same group that has worked through accounting in MBA-501, economics in MBA-502 and leadership in MBA-503. Daniel Osei is the plant controller at Northfield Components, a maker of metal stampings and welded assemblies. Hana Kowalski runs operations for Lakeview Health, a not-for-profit group of clinics and a community hospital. Leo Brandt is co-founder and chief financial officer of Kestrel Analytics, a software company that sells inventory forecasting to retailers. Grace Mwangi is a category manager at Fairway Grocers, a regional supermarket chain. Owen Tremblay is finance manager at Prairie Ridge Energy, which runs gas processing plants and a growing fleet of wind and solar farms. All five have more data than they can use. None of them, they admit, is confident about what the numbers are telling them.
Dr. Zhou makes three promises about the course. It will not turn the managers into statisticians, but it will make them demanding customers of analysis, able to ask the questions that expose a weak argument. It will be built around decisions rather than techniques: every method is introduced because a manager needs it to make a better choice. And it will be honest about uncertainty. Most of the damage done by data in organizations, she argues, comes not from complicated mathematics but from simple errors made confidently: confusing a correlation with a cause, reading noise as a trend, ignoring how a sample was chosen, or treating a forecast as a fact.
Start with the decision, not the data
The first habit of a manager who thinks well with data is to start from the decision. Before asking for an analysis, write down what you will do differently depending on the answer. If no plausible result would change the action, the analysis is not worth commissioning, however interesting it sounds. Hana describes a recent request from her board for a report on patient satisfaction by clinic. When Dr. Zhou asks what the board would do with it, Hana realizes that the board has no lever: clinic staffing is set by a provincial funding formula, and the board does not choose which clinics to keep open. The useful question is narrower. Which of the things Lakeview does control, such as appointment reminders, booking hours and the triage process, are associated with complaints, and would changing them be worth the cost?
A good analytical question has four parts. It names the decision and the person who will make it. It states the options being compared. It specifies the measure of success, such as cost, revenue, wait time or risk. And it sets a deadline that reflects when the decision must be taken, because a perfect answer delivered after the decision is worth nothing. Dr. Zhou calls this the decision brief, and she asks each manager to write one on a page before any data is pulled.
| Part of the brief | Weak version | Strong version |
|---|---|---|
| Decision | Understand our customers better | Decide whether to extend Saturday hours at three clinics |
| Options | Not stated | Keep current hours; extend at all three; pilot at one for twelve weeks |
| Measure | Satisfaction | Walk-in visits avoided at the emergency department, staff overtime cost |
| Deadline | When ready | Before the staffing plan is set on 15 March |
Data are measurements made by someone, for some purpose
Every number in an organization was produced by a process: someone decided what to count, how to record it and when. Before trusting a figure, a manager should know how it was generated. Grace gives an example from Fairway. The chain's reports show that shrink, the value of stock lost to damage, spoilage and theft, is far lower at its newest stores. On closer inspection, the newer stores use a different handheld scanner that only records spoiled produce when a supervisor approves the write-off. The measured difference is partly a difference in measurement. Dr. Zhou calls these data-generating processes, and she says that understanding them is worth more than any technique taught later in the course.
Three questions help. First, what population does the data describe, and who is missing? Customers who answer a survey are not the same as all customers, and patients who complete their treatment are not the same as all patients who start it. Second, how was each value measured, and could the measurement have changed over time or between groups? A new definition of an active user, a switch in accounting systems or a change in who records the data can create apparent trends. Third, why was the data collected? Data gathered for one purpose, such as billing, often fits awkwardly when used for another, such as measuring quality of care.
Variation, signal and noise
Almost every business number varies from week to week for reasons nobody can identify. Sales at a store differ between two Tuesdays because of weather, a local event, a delayed delivery or nothing anyone could name. The manager's job is to separate signal, a change that reflects something real and lasting, from noise, the background variation that would occur anyway. The most common error is to react to noise: praising the store manager whose sales rose last week, criticizing the one whose sales fell, and then watching both numbers drift back towards the average. The statistician Francis Galton described this drift, regression to the mean, in the 1880s when studying the heights of parents and children, and it is everywhere in management.
Regression to the mean has a direct implication for evaluating interventions. If Northfield sends its three worst-performing production lines for extra training after an unusually bad month, those lines are likely to improve the next month whether or not the training works, simply because an unusually bad month is unlikely to be repeated. Daniel recognizes the pattern from a consultant's report that claimed a 30 per cent improvement in defect rates after a quality program aimed at the worst lines. Without a comparison group of similar lines that did not get the program, the claim cannot be separated from regression to the mean.
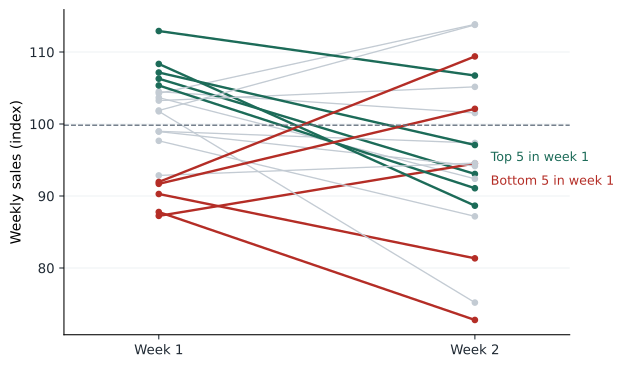
# Regression to the mean with no intervention at all
import random
random.seed(504)
stores = 40
true_level = [random.gauss(100, 6) for _ in range(stores)]      # each store's real weekly sales level
week1 = [t + random.gauss(0, 8) for t in true_level]               # noise on top of the real level
week2 = [t + random.gauss(0, 8) for t in true_level]

order = sorted(range(stores), key=lambda i: week1[i])
bottom, top = order[:8], order[-8:]
avg = lambda xs: sum(xs) / len(xs)
print(f"Bottom 8 stores: week 1 average {avg([week1[i] for i in bottom]):.1f}, week 2 average {avg([week2[i] for i in bottom]):.1f}")
print(f"Top 8 stores:    week 1 average {avg([week1[i] for i in top]):.1f}, week 2 average {avg([week2[i] for i in top]):.1f}")
print(f"All stores: week 1 average {avg(week1):.1f}, week 2 average {avg(week2):.1f}")Bottom 8 stores: week 1 average 83.5, week 2 average 97.5 Top 8 stores: week 1 average 114.7, week 2 average 103.4 All stores: week 1 average 98.6, week 2 average 100.4
The simulation gives every store a fixed underlying level of sales and adds random weekly noise. Nothing changes between the two weeks. Yet the bottom eight stores appear to improve and the top eight appear to decline, because stores that looked extreme in week one were partly unlucky or lucky. A manager who had sent the bottom stores on a training course in between would have seen an apparent success. The only defence is a comparison: what happened to similar stores that did not receive the intervention?
Questions to ask of any analysis
Dr. Zhou gives the cohort a short list of questions to ask whenever someone presents an analysis. Compared with what? A number on its own means little until it is set against a baseline, a target, a previous period or a comparison group. How big is the effect in units that matter? A change that is statistically detectable may be too small to justify action, and a large effect may be estimated so imprecisely that the true value could be zero. How uncertain is the estimate? Every estimate from a sample comes with a range of plausible values, and a single number presented without one invites overconfidence. What else could explain the result? Alternative explanations, especially selection, confounding and chance, should be ruled out before a causal story is accepted. And what would change our mind? A conclusion that no evidence could overturn is a belief, not an analysis.
Leo, whose company sells analytics to retailers, admits that his own sales team rarely asks these questions of the results they show clients. A typical slide reports that customers using Kestrel's forecasting tool reduced stockouts by 18 per cent. Compared with what? Retailers who chose to buy the tool may already have been better managed than those who did not, and stockouts fell across the industry that year as supply chains recovered. The honest claim is narrower and less impressive, but it is the claim that will survive a skeptical buyer's analysis.
Data sources for managers
Many of the most useful numbers for a manager are published free by statistical agencies. Statistics Canada publishes data on population, employment, prices, retail sales, business conditions and much more, including regular surveys of how businesses are using technology. Its surveys reported that the share of Canadian businesses using artificial intelligence roughly doubled over a recent year, while remaining a minority of firms. Provincial agencies, the Bank of Canada and industry associations add more. Using an official series as a benchmark, for example comparing Fairway's sales growth with provincial grocery sales, is one of the simplest ways to answer the question compared with what.
Internal data has the advantage of being specific to the business and the disadvantage of reflecting the business's own blind spots. Transaction records show what customers bought, not what they wanted and could not find. Complaint logs record the people who complained, not the larger number who left quietly. Survey data show what people say, which may differ from what they do. A manager who combines internal records with external benchmarks and a small amount of carefully designed new data, such as a test or a short survey, usually learns more than one who searches ever larger internal databases.
The course ahead
The rest of the course follows the path of a typical analysis. Lesson 2 covers describing data well, because a good chart often answers the question before any test is needed. Lessons 3 to 6 deal with probability, sampling and testing, including the experiments that companies such as Leo's now run constantly. Lessons 7 to 9 turn to relationships between variables: correlation, causation and regression, the workhorse of business analysis. Lesson 10 is about forecasting, and lesson 11 about decision analysis, which brings uncertainty and value together in a single framework. The capstone in lesson 12 returns to Cedarline Outdoor, the apparel company the cohort analysed in MBA-501, MBA-502 and MBA-503, and asks for a recommendation grounded in its data.
Worked problem
Writing Owen's decision brief
Prairie Ridge's maintenance team wants funding for vibration sensors on all 64 of its wind turbines, arguing that the data will reduce gearbox failures. Owen is asked to recommend whether to approve the request.
Show solution
- Decision: approve sensors on all 64 turbines, on none, or on a subset as a trial.
- Measure: avoided gearbox failures and downtime, valued at lost generation plus repair cost, against the sensor and monitoring cost.
- Data needed: historical failure rates, the cost of each failure, and evidence on how often sensors give early enough warning to prevent a failure.
- Comparison: a staged trial on half the turbines of one model, with the other half as a comparison group, would show whether warnings lead to fewer failures.
Answer: Owen recommends a twelve-month trial on 16 turbines of the model with the highest failure rate, with 16 similar turbines as the comparison, and a decision on the full fleet at the end of the year. The brief keeps the decision in view and builds in the comparison that the original request lacked.
Common mistakes
MistakeMore data always leads to better decisions.
InsteadData helps only if it bears on a decision; start with the decision and the options.
MistakeA change after an intervention proves the intervention worked.
InsteadWithout a comparison group, regression to the mean and other trends can produce the same change.
MistakeInternal data is objective because it comes from systems.
InsteadEvery figure reflects choices about what to measure and how; know the data-generating process.
MistakeA number is meaningful on its own.
InsteadAlways ask compared with what: a baseline, a target, a benchmark or a control group.
Summary and key terms
- Write a decision brief before requesting analysis: decision, options, measure and deadline.
- Understand how data were generated, who is missing and what changed in measurement.
- Separate signal from noise and expect regression to the mean after extreme results.
- Ask of every analysis: compared with what, how big, how uncertain, what else, and what would change our mind.
- Combine internal records with external benchmarks and well-designed new data.
- Decision brief
- A one-page statement of the decision, options, success measure and deadline that an analysis must serve.
- Data-generating process
- The way data came to be recorded, including who was counted and how values were measured.
- Noise
- Random variation that would occur even if nothing real had changed.
- Regression to the mean
- The tendency of extreme results to be followed by results closer to the average.
- Benchmark
- An external or historical comparison used to judge whether a result is unusual.
Practice problems
Work each problem on paper first, then reveal the answer to check.
A store's sales fell 12 per cent last month and the regional manager wants to replace its manager. What would you ask first?
Show answer
Compared with what: how did similar stores do that month, and how variable has this store's monthly sales been in the past? A single bad month may be noise, and the next month is likely to be closer to normal anyway.
Rewrite this request as a decision brief: give me a report on employee turnover.
Show answer
For example: decide whether to fund a retention bonus for night-shift nurses (options: no bonus, bonus for all, bonus pilot on two units), measured by twelve-month turnover and overtime cost, before the budget is set in May.
Why can a survey of customers who contacted support give a misleading picture of all customers?
Show answer
People who contact support are more likely to have had problems, so they are not representative of all customers; the data describe a selected group.
A consultant reports that the three worst-performing sales regions improved by 20 per cent after a coaching program. What alternative explanation should you consider?
Show answer
Regression to the mean: regions chosen for being worst in one period tend to improve in the next anyway. A comparison group of similar regions without coaching is needed.
Lesson quiz · 5 questions
Score 60% or more to complete this lesson.
Create a free account to save your progress, take quizzes and earn a certificate.