
ITIL-130 · Lesson 9 of 12 · 32 min
Designing and optimizing value streams
A value stream map of the current state is only the beginning. Its purpose is to help the organization design a better future state and move toward it. This lesson explains how to optimize value streams: removing waste, managing flow and bottlenecks, limiting work in progress, reducing handoffs and approvals, and automating where it helps. It also covers how to prioritize improvements, how to think about complexity, and how to measure whether the redesigned stream actually delivers more value.
From current state to future state
Optimization starts with the current-state map from lesson 8. The team asks: what would this value stream look like if it were designed to deliver value to the consumer as quickly and reliably as possible? The answer is a future-state map, showing fewer steps, shorter waits and higher %C&A. The future state is a target, not a promise. The organization moves toward it through a series of improvements, applying the guiding principle progress iteratively with feedback.
The ITIL guiding principles provide a useful checklist for optimization. Focus on value asks whether each step matters to the consumer. Start where you are asks what already works. Keep it simple and practical asks which steps can be removed. Optimize and automate asks, in that order, how to improve and then automate. Think and work holistically reminds the team that improving one step at the expense of others does not improve the stream.
Types of waste
Lean thinking identifies several types of waste that appear in service value streams as much as in factories. Recognizing them helps teams see opportunities they might otherwise accept as normal.
| Type of waste | In service management | Example |
|---|---|---|
| Waiting | Work sits in queues or awaits approval | A request waits three days for a manager's sign-off |
| Overprocessing | Doing more than the consumer needs | A 40-field form for a simple software request |
| Defects and rework | Errors that must be corrected | A laptop configured with the wrong software |
| Handoffs and transport | Moving work between teams | A ticket reassigned five times before resolution |
| Overproduction | Producing outputs nobody uses | Weekly reports that no one reads |
| Inventory | Excess work in progress | A backlog of 600 half-started requests |
| Motion | Unnecessary effort by staff | Searching several systems for the same information |
| Unused talent | Not using people's skills and ideas | Support staff never asked how to improve the stream |
Bottlenecks and constraints
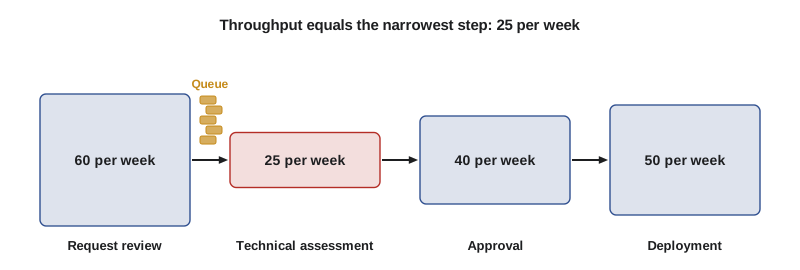
Every value stream has a constraint: the step with the lowest capacity relative to demand. Work piles up before it and flows freely after it. Improving any other step does not increase the throughput of the whole stream; it simply moves more work into the queue before the constraint. This idea, from the theory of constraints, is a powerful guide to where improvement effort should go.
Worked problem
Finding the constraint
A change value stream has four steps with these capacities per week: request review 60, technical assessment 25, approval 40, deployment 50. Demand averages 30 changes a week. Where is the constraint, and what happens if the deployment team doubles its capacity?
Show solution
- Throughput of a stream is limited by its slowest step: technical assessment at 25 per week.
- Demand (30) exceeds that capacity, so a queue of about 5 changes a week builds before technical assessment.
- Doubling deployment capacity to 100 does nothing for throughput, which stays at 25 a week.
- Effort should go to technical assessment: adding capacity, simplifying assessments for low-risk changes, or pre-approving standard changes.
Answer: Technical assessment is the constraint at 25 a week. Doubling deployment capacity has no effect on throughput; only improving the constraint helps.
Limiting work in progress
Little's Law, introduced in lesson 7, shows that for a given throughput, more work in progress means longer lead times. Many teams start too much work at once, believing it makes them productive. In practice, it increases waiting, context switching and the chance that urgent items get stuck behind half-finished ones. Limiting work in progress (WIP) is one of the simplest and most effective optimizations. Kanban boards with explicit WIP limits make the limit visible and encourage teams to finish work before starting more.
Worked problem
Effect of a WIP limit on lead time
A team completes 10 items a week. It currently has 60 items in progress. If it introduces a WIP limit and reduces work in progress to 20 items while keeping the same throughput, what happens to the average lead time?
Show solution
- Little's Law: lead time W = WIP ÷ throughput.
- Current: 60 ÷ 10 = 6 weeks.
- With WIP limit: 20 ÷ 10 = 2 weeks.
- In practice, throughput often rises too, because less context switching makes staff more effective.
Answer: Average lead time falls from 6 weeks to 2 weeks, even without any increase in throughput.
Reducing handoffs and approvals
Each handoff between teams adds a queue, a chance for misunderstanding and a loss of context. Approvals add similar delays and are often retained long after the risk they were meant to control has disappeared. Optimization asks, for each handoff, whether one cross-skilled team could perform both steps, and for each approval, whether the risk justifies it or whether a pre-authorized standard change, a policy or an automated check would be enough.
Worked problem
Removing an approval step
An access request stream includes a director's approval after the manager's approval. Records show the director approved all 1,450 requests last year, with an average wait of 2.5 working days. Each request has about 0.5 working days of process time in total and a lead time of 6 working days. What happens to lead time and flow efficiency if the director's approval is removed for standard access?
Show solution
- New lead time: 6 − 2.5 = 3.5 working days.
- Flow efficiency before: 0.5 ÷ 6 ≈ 8.3 %. After: 0.5 ÷ 3.5 ≈ 14.3 %.
- Risk check: the director approved every request, so the step was not controlling risk in practice.
- Controls can be retained through manager approval, role-based access rules and periodic access reviews.
Answer: Lead time falls from 6 to 3.5 working days and flow efficiency rises from about 8 % to about 14 %, without a meaningful loss of control.
Automation
Automation can remove waiting and manual effort, but only after the stream has been simplified and optimized. Automating a wasteful step makes waste faster and harder to change. Good automation candidates are steps that are frequent, standardized, rule-based and error-prone when done by hand: account creation, software deployment, standard approvals based on clear rules, and notifications. ITIL-150 covers automation, DevOps and AI in more depth.
Worked problem
Automation payback within a value stream
Account creation takes 45 minutes of manual work per new hire and has 80 % accuracy. The organization hires 600 people a year. Automating it would cost $30,000 to build and $5,000 a year to run, cutting work to 5 minutes and raising accuracy to 98 %. Staff time costs $60 per hour, and each correction costs 30 minutes. What is the annual saving and payback?
Show solution
- Manual time saved: 600 × 40 minutes = 24,000 minutes = 400 hours, worth $24,000.
- Corrections before: 600 × 20 % = 120; after: 600 × 2 % = 12. Saved: 108 × 0.5 hours = 54 hours, worth $3,240.
- Gross annual saving: $24,000 + $3,240 = $27,240; net of running cost: $22,240.
- Payback: $30,000 ÷ $22,240 ≈ 1.35 years, about 16 months.
Answer: Net saving about $22,240 a year; payback about 16 months, plus faster onboarding for new hires.
Prioritizing value stream improvements
A current-state map usually reveals more improvement opportunities than a team can pursue at once. Prioritization should consider the effect on lead time and %C&A, the effort required, and whether the improvement addresses the constraint. Cost of delay and WSJF, from lesson 2, work well here. Improving the constraint first usually gives the biggest gain; improvements elsewhere may wait until the constraint moves.
Complexity and experimentation
Published Version 5 course outlines mention complexity thinking alongside workflow optimization. Some value streams are simple and predictable: the same steps every time, with well-understood cause and effect. Others are complex: outcomes depend on many interacting factors and cannot be fully predicted. Simple streams can be optimized with standard procedures and automation. Complex streams benefit more from small experiments, fast feedback and adaptation. Recognizing which kind of stream you are dealing with helps choose the right approach.
| Kind of value stream | Characteristics | Suitable approach |
|---|---|---|
| Simple | Repeatable, cause and effect obvious | Standardize, document, automate |
| Complicated | Cause and effect knowable with expertise | Analyse with experts, then design |
| Complex | Cause and effect clear only in hindsight | Run small experiments, observe, adapt |
Measuring the future state
Every improvement should be measured against the baseline from the current-state map. Useful measures include lead time, flow efficiency, rolled %C&A, throughput and consumer outcomes such as satisfaction or effort scores. Measuring both speed and quality guards against improvements that speed things up at the cost of more errors.
Worked problem
Comparing current and future state
After optimization, the onboarding stream from lesson 8 has these figures: process time 4.5 hours, waiting time 30 hours, and step %C&A of 90 %, 95 %, 95 %, 98 % and 95 %. Compare with the current state (process time 5.25 hours, lead time 93.25 hours, rolled %C&A about 41 %).
Show solution
- New lead time: 4.5 + 30 = 34.5 hours, down from 93.25 (a 63 % reduction).
- New flow efficiency: 4.5 ÷ 34.5 ≈ 13 %, up from about 5.6 %.
- New rolled %C&A: 0.90 × 0.95 × 0.95 × 0.98 × 0.95 ≈ 0.756, about 76 %, up from about 41 %.
- The stream is both faster and more accurate; the next round of improvement can target the remaining waits.
Answer: Lead time falls about 63 %, flow efficiency more than doubles to about 13 %, and rolled %C&A rises from about 41 % to about 76 %.
Public bodies in Canada increasingly publish service standards, for example the time to process an application, as required by the Treasury Board Policy on Service and Digital. Value stream optimization is one way departments work toward those published standards.
Sustaining the improved stream
Improvements to a value stream tend to fade unless they are sustained. People return to old habits, new approvals creep back in, and work in progress grows again. Sustaining the future state requires visible measures (for example, lead time and WIP displayed on a team board), regular reviews of the stream, and clear ownership. Many organizations appoint a value stream owner who is accountable for the end-to-end flow, not for any single team within it. The owner watches the measures, convenes the teams when performance slips and keeps the next round of improvement moving.
Common mistakes
MistakeImproving the steps that are easiest to change.
InsteadFind the constraint and improve it first, since it limits throughput.
MistakeStarting more work to keep everyone busy.
InsteadLimit work in progress to shorten lead times and reduce context switching.
MistakeAutomating a value stream before simplifying it.
InsteadSimplify and optimize first, then automate stable, rule-based steps.
MistakeKeeping approvals that never reject anything.
InsteadReview approvals against the risk they control and replace them with policies or automated checks where possible.
MistakeMeasuring only speed after a redesign.
InsteadMeasure lead time, quality (%C&A) and consumer outcomes together.
Summary and key terms
- Optimization designs a future-state value stream and moves toward it iteratively.
- Lean waste categories, such as waiting, rework and handoffs, help reveal improvement opportunities.
- The constraint limits throughput; improving other steps does not increase it.
- Limiting work in progress shortens lead time, as Little's Law shows.
- Removing unnecessary approvals and handoffs reduces delay without necessarily reducing control.
- Automate only after simplifying, and calculate payback including running costs.
- Match the approach to the stream: standardize simple ones, experiment with complex ones, and measure speed and quality together.
- Future-state map
- A value stream map showing the target design after improvement.
- Waste
- Any activity or delay that consumes resources without adding value for the consumer.
- Constraint
- The step with the lowest capacity relative to demand, which limits throughput.
- Throughput
- The number of items completed per unit of time.
- Work in progress (WIP) limit
- A cap on the number of items a team or step works on at once.
- Kanban
- A visual method of managing flow, often using boards and WIP limits.
- Handoff
- The transfer of work from one person or team to another.
- Standard change
- A low-risk, pre-authorized change that follows a known procedure.
- Context switching
- The productivity loss from moving between several pieces of work.
- Complexity thinking
- Recognizing when outcomes cannot be predicted and favouring experiments and adaptation.
Practice problems
Work each problem on paper first, then reveal the answer to check.
Name four types of waste in service value streams.
Show answer
Waiting, rework, handoffs and overprocessing (also overproduction, inventory, motion, unused talent).
Steps have capacities 50, 30, 45 and 60 per week. What is the throughput of the stream?
Show answer
30 per week, set by the constraint.
Throughput is 8 items a week and WIP is 40. What is the average lead time?
Show answer
5 weeks.
If WIP falls to 16 at the same throughput, what is the new lead time?
Show answer
2 weeks.
Why simplify before automating?
Show answer
Automating waste makes it faster and harder to change.
An approval has never rejected a request. What should be considered?
Show answer
Removing it or replacing it with a policy, standard change or automated check.
What kind of value stream benefits most from small experiments?
Show answer
A complex one, where cause and effect are clear only in hindsight.
Lead time falls from 80 to 32 hours. What is the percentage reduction?
Show answer
60 %.
Why measure %C&A as well as lead time after a redesign?
Show answer
To ensure speed has not been gained at the cost of more errors.
Which guiding principle warns against improving one step at the expense of the stream?
Show answer
Think and work holistically.
Lesson quiz · 5 questions
Score 60% or more to complete this lesson.
Create a free account to save your progress, take quizzes and earn a certificate.