
ITIL-130 · Lesson 8 of 12 · 29 min
Value streams: concepts and mapping
The six value chain activities are generic. They describe what any service organization does, but not how a particular piece of work flows from demand to value. Value streams fill that gap. A value stream is a series of steps an organization undertakes to create and deliver products and services to consumers. This lesson explains what value streams are, how they relate to the value chain and to processes, and how to map one step by step using measures such as lead time, process time, percent complete and accurate, and flow efficiency.
What a value stream is
A value stream starts with a trigger (usually a type of demand or opportunity) and ends with value realized by a consumer. In between, it passes through a sequence of steps, each of which uses one or more value chain activities and draws on practices. A value stream is specific: "restore a failed customer-facing service", "onboard a new employee" and "release a new mobile app feature" are three different value streams, each with its own steps, timings and participants.
Value streams make the abstract value chain concrete. They show how work actually flows, where it waits, who touches it and how long it takes. Because they cross teams and departments, they also expose the handoffs and silos that the system model aims to reduce.
| Concept | What it describes | Example |
|---|---|---|
| Value chain activity | A generic type of work every organization does | Engage |
| Value stream | A specific flow of steps for one type of demand | Onboard a new employee |
| Process | A set of interrelated activities that transform inputs into outputs, often within a practice | Approve an access request |
| Practice | A set of organizational resources for performing work | Service request management |
Value streams and processes
Processes and value streams are related but not the same. A process is a set of interrelated or interacting activities that transforms inputs into outputs. Processes usually describe how a specific piece of work is done, often within one practice: how to log an incident, how to assess a change. A value stream describes the end-to-end flow from demand to value and may use many processes from many practices along the way. One step in a value stream may be performed by a whole process; one process may support several value streams.
Core and enabling value streams
Published ITIL (Version 5) course outlines describe value streams as core or enabling. A core value stream delivers value directly to consumers: fulfilling a customer order, restoring a service, delivering a new feature. An enabling value stream supports the core streams: recruiting and training staff, onboarding a supplier, refreshing infrastructure. Even in ITIL 4 terms the distinction is useful, because it helps organizations see which flows the customer experiences directly and which support them behind the scenes.
Worked problem
Classifying value streams
Classify each of these value streams of a managed IT service provider as core or enabling: (a) restore a client's failed email service; (b) hire and train new service desk agents; (c) onboard a new client; (d) renew the provider's data centre hardware; (e) deliver a monthly service review to a client.
Show solution
- (a) Core: it restores value directly for the client.
- (b) Enabling: it builds capability used by core streams.
- (c) Core: the client experiences onboarding directly and it starts value delivery.
- (d) Enabling: it maintains infrastructure behind the scenes.
- (e) Core: the client receives the review as part of the service relationship.
Answer: Core: (a), (c) and (e). Enabling: (b) and (d).
Why map value streams?
Value stream mapping is a technique borrowed from Lean manufacturing and widely used in service management. A map shows each step of a value stream, who performs it, how long it takes and how long work waits between steps. The purpose is to see the whole flow, find delays and waste, and design improvements. Maps often surprise the people who work in the stream, because each person sees only their own steps.
Key measures
Several measures appear on most value stream maps. Lead time is the elapsed time from the trigger to delivery of value. Process time (sometimes called touch time or value-adding time) is the time someone is actually working on the item. Waiting time is lead time minus process time. Percent complete and accurate (%C&A) is the share of items a step receives that it can use without correction, clarification or rework. Flow efficiency is process time divided by lead time.
The rolled percent complete and accurate is the product of the %C&A of each step. It shows the share of items that pass through the whole stream without any rework. Even when each step looks reasonable, the rolled figure can be low.
Mapping step by step
Mapping a value stream follows a straightforward sequence. First, choose the value stream and define its trigger and its end point. Second, walk the stream with the people who do the work, recording each step. Third, measure process time, waiting time and %C&A at each step, using real data where possible. Fourth, calculate totals: lead time, process time, flow efficiency and rolled %C&A. Fifth, identify the biggest delays and sources of rework. Lesson 9 covers the final step: designing the improved future state.
Worked problem
Mapping an employee onboarding value stream
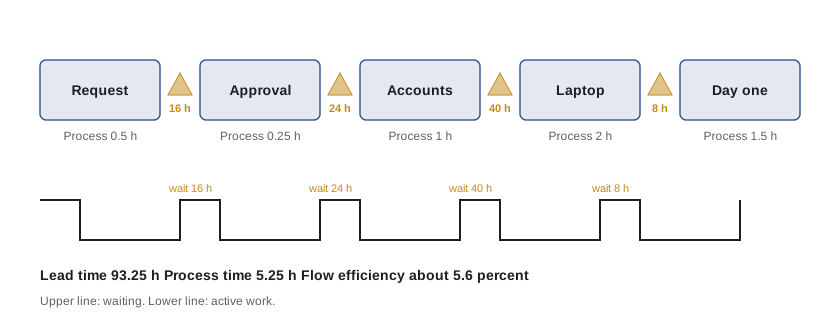
An organization maps onboarding from "offer accepted" to "new employee productive on day one". Steps (process time; waiting time before the step; %C&A): (1) HR submits request (0.5 h; 0 h wait; 70 %); (2) manager approves access (0.25 h; 16 h wait; 90 %); (3) IT creates accounts (1 h; 24 h wait; 80 %); (4) IT prepares laptop (2 h; 40 h wait; 95 %); (5) day-one setup (1.5 h; 8 h wait; 85 %). Using working hours, calculate lead time, process time, flow efficiency and rolled %C&A.
Show solution
- Process time: 0.5 + 0.25 + 1 + 2 + 1.5 = 5.25 hours.
- Waiting time: 0 + 16 + 24 + 40 + 8 = 88 hours.
- Lead time: 5.25 + 88 = 93.25 working hours (about 11.7 eight-hour days).
- Flow efficiency: 5.25 ÷ 93.25 ≈ 5.6 %.
- Rolled %C&A: 0.70 × 0.90 × 0.80 × 0.95 × 0.85 ≈ 0.407, so only about 41 % of onboardings go through without any rework.
Answer: Lead time about 93 working hours, process time 5.25 hours, flow efficiency about 5.6 %, rolled %C&A about 41 %. The biggest opportunities are the 40-hour wait for laptops and the 70 % accuracy of the initial HR request.
Reading the map
The numbers from the onboarding example are typical. Flow efficiency below 10 % is common in service organizations, because work spends most of its time waiting in queues, for approvals or for handoffs. The rolled %C&A shows that rework is also common: more than half of new hires experience some correction along the way, such as a missing access right or a wrongly configured laptop.
When reading a map, look for the longest waits, the lowest %C&A values, steps that add no value from the consumer's viewpoint, and places where work loops back. Each is a candidate for improvement. The first step with low %C&A deserves particular attention, because errors introduced early cause rework at every later step.
| Signal on the map | Likely cause | Possible improvement |
|---|---|---|
| Long wait before a step | Queue, batch processing or scarce resource | Limit work in progress; process continuously; add capacity |
| Low %C&A at a step | Unclear or incomplete inputs from the previous step | Standard forms; validation at entry; better communication |
| Many handoffs | Work split across specialist teams | Cross-skilled teams; fewer approvals |
| Step adds no value for the consumer | Historical control or habit | Remove or simplify the step |
| Work loops back | Errors discovered late | Move checks earlier; fix the source of errors |
Value streams and the value chain
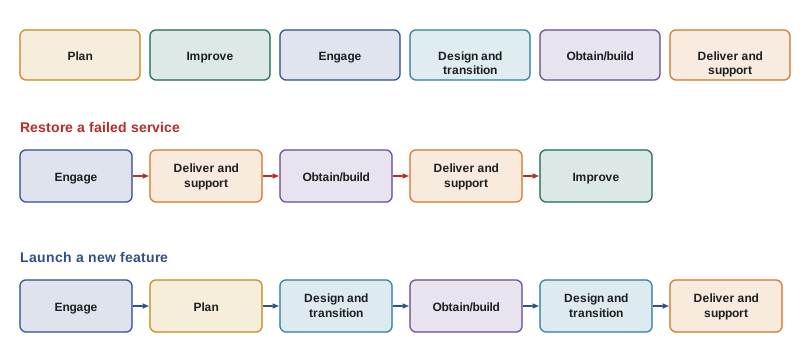
Each step of a value stream can be labelled with the value chain activity it represents. In the onboarding example, the HR request is engage; approval and account creation draw on deliver and support (service request fulfilment); laptop preparation is obtain/build; day-one setup is deliver and support, with engage for the new employee's experience. Labelling steps this way shows how the generic activities combine in a specific flow and helps identify which practices and teams contribute.
Value streams for incident restoration
Not every value stream is about new things. Restoring a failed service is one of the most important core value streams in any organization. Mapping it often reveals long waits for the right specialist, missing knowledge and poor communication with users. Measures such as mean time to restore service are lead-time measures for this value stream.
Worked problem
Lead time for incident restoration
An incident restoration value stream has these steps (process time; wait before step): detect and log (5 min; 15 min wait for user to report); triage at service desk (10 min; 10 min wait); assign to specialist team (2 min; 45 min wait); diagnose and fix (40 min; 20 min wait for specialist to pick up); confirm with user (5 min; 30 min wait for user). Calculate lead time and flow efficiency, and suggest one improvement.
Show solution
- Process time: 5 + 10 + 2 + 40 + 5 = 62 minutes.
- Waiting time: 15 + 10 + 45 + 20 + 30 = 120 minutes.
- Lead time: 182 minutes (just over 3 hours). Flow efficiency: 62 ÷ 182 ≈ 34 %.
- Improvement: monitoring could detect the failure before users report it, removing the 15-minute wait; automatic routing could remove much of the 45-minute assignment wait.
Answer: Lead time about 182 minutes, flow efficiency about 34 %. Proactive monitoring and automatic routing target the largest waits.
Practical tips for mapping
Map the stream as it actually works today, not as the procedure says it should. Involve people from every step; each knows something the others do not. Use real data from ticketing systems where possible, but check it against observation, because recorded times may not reflect reality. Keep the first map simple: five to twelve steps is usually enough. And agree in advance what the map is for, so it leads to improvement rather than blame.
Common mistakes
MistakeMapping the value stream as the documented procedure describes it.
InsteadMap how work actually flows today, observed with the people who do it.
MistakeConfusing value streams with processes.
InsteadA value stream is the end-to-end flow from demand to value; processes describe specific pieces of work within it.
MistakeMeasuring only process time.
InsteadMeasure waiting time and %C&A too; most delay and rework hides there.
MistakeAveraging %C&A across steps.
InsteadMultiply the step values to find the rolled %C&A for the whole stream.
MistakeUsing maps to assign blame.
InsteadUse maps to see the system and design improvements together.
Summary and key terms
- A value stream is a series of steps an organization undertakes to create and deliver products and services to consumers.
- Value streams combine value chain activities in specific orders and use processes from many practices.
- Version 5 course outlines describe core value streams, which deliver value directly, and enabling ones, which support them.
- Value stream maps show steps, process time, waiting time and percent complete and accurate.
- Flow efficiency equals process time divided by lead time and is often below 10 %.
- Rolled %C&A is the product of step values and shows the share of items with no rework.
- Map the current reality with the people who do the work, then use the map to improve.
- Value stream
- A series of steps an organization undertakes to create and deliver products and services to consumers.
- Core value stream
- A value stream that delivers value directly to consumers.
- Enabling value stream
- A value stream that supports core value streams.
- Process
- A set of interrelated or interacting activities that transforms inputs into outputs.
- Value stream mapping
- A technique for visualizing the steps, times and quality of a value stream.
- Lead time
- Elapsed time from the trigger of a value stream to the delivery of value.
- Process time
- Time spent actively working on an item.
- Percent complete and accurate (%C&A)
- The share of items a step can use without correction or rework.
- Rolled %C&A
- The product of each step's %C&A, showing the share of items with no rework.
- Trigger
- The event or demand that starts a value stream.
Practice problems
Work each problem on paper first, then reveal the answer to check.
Define a value stream in your own words.
Show answer
The series of steps an organization takes to create and deliver a product or service to consumers, from trigger to value.
How does a value stream differ from a process?
Show answer
A value stream is the end-to-end flow; a process is a set of activities transforming inputs into outputs, often within one practice.
A stream has 3 hours of process time and a lead time of 60 hours. What is its flow efficiency?
Show answer
3 ÷ 60 = 5 %.
Three steps have %C&A of 90 %, 80 % and 75 %. What is the rolled %C&A?
Show answer
0.9 × 0.8 × 0.75 = 0.54, or 54 %.
Is hiring new staff a core or enabling value stream for a service provider?
Show answer
Enabling.
Name three measures typically shown on a value stream map.
Show answer
Process time, waiting time and %C&A (also lead time and flow efficiency).
Why should maps show current reality rather than the documented procedure?
Show answer
Improvement depends on understanding how work actually flows, including workarounds and waits.
What does a low %C&A at the first step suggest?
Show answer
Inputs are unclear or incomplete, causing rework in every later step.
Lead time is 150 minutes and process time 45. What is the waiting time?
Show answer
105 minutes.
Which value chain activity does preparing a laptop for a new hire mainly represent?
Show answer
Obtain/build.
Lesson quiz · 5 questions
Score 60% or more to complete this lesson.
Create a free account to save your progress, take quizzes and earn a certificate.