
HSE-407 · Lesson 12 of 12 · 20 min
Capstone: a metrics and audit framework for Harrowgate
Eighteen months after Rachel Okoye's question about the green report, Elena Novak presented the complete safety performance framework to the board of directors's safety committee, together with the results of its first full year. This capstone lesson brings together everything in the course. It sets out the framework as Harrowgate Foods Ltd. adopted it, reviews the first year's results honestly, and describes how the framework will be kept alive. Use it as a model for building or reviewing a framework in your own organization.
The framework on one page
Elena's first slide showed the whole framework as a cycle, with five connected parts: the indicators, the inspection and verification program, the audit program, data governance, and reporting and review. Each part fed the others. Inspections and verifications produced data for the indicators. Audits tested whether the inspections, verifications and data could be trusted. Data governance kept definitions and records consistent. Reporting turned the results into decisions, and the annual review changed the framework itself.
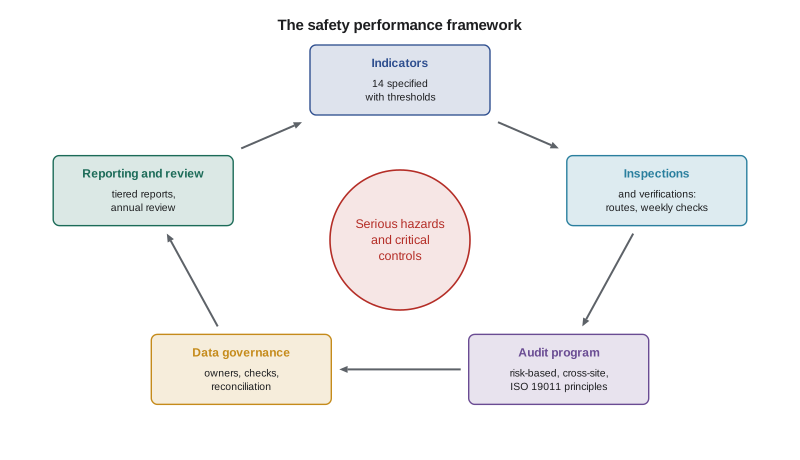
At the centre of the cycle sat the nine serious hazards and their critical controls. Every part of the framework could be traced back to them. An indicator that did not relate to a serious hazard, a control or the health of the system had to justify its place, and several were dropped during the year for that reason.
The indicators
The final indicator set had fourteen indicators in five groups, each with a written specification as described in Lesson 5:
| Group | Indicators | Board sees | Owner |
|---|---|---|---|
| Outcomes | Recordable rate (TRIF); LTIF; serious injuries and fatalities | All three | Nina Castillo |
| Serious injury precursors | SIF-potential events per 200,000 hours; share investigated within 10 days | Both | Elena Novak |
| Critical controls | Verification pass rates for lockout, forklift separation and guarding; ammonia specialist items overdue | All four | Site managers; Luis Ortega for ammonia |
| Response | Corrective actions closed on time; high-risk findings open more than 30 days | Overdue items only | Site managers |
| Reporting and culture | Near misses per 100 workers; pulse questions on stopping unsafe work and on problems being fixed | All three | Elena Novak with committee co-chairs |
Every indicator had an attention level and an action level, and every status colour came from them. Lagging indicators were reported as rolling twelve-month rates with counts, confidence intervals and u-charts. No indicator was linked to individual bonuses. The management bonus that remained was based on completing the agreed improvement plan, as verified by audit, not on any number in the table.
Inspections, verifications and audits
The inspection program covered every area of every site on a quarterly rotation, with at least one night or weekend inspection a month, high-risk points marked on each route, and an open section and worker question on every form. Critical control verifications were done weekly by supervisors and trained workers, unannounced and spread across shifts in proportion to the work. Specialist inspections were tracked on a register with due dates.
The audit program set frequencies by risk, results and change, with a floor of one audit a year for topics with catastrophic potential. Audits were done by trained cross-site teams and quality auditors, followed ISO 19011's principles, used triangulated evidence and stated sample sizes, and graded findings in the same way at every site. Food safety and worker safety audits were combined where processes overlapped. The company also decided, after the first year, to seek ISO 45001 certification for the Truro plant, to add independent assurance to its own audits.
Data governance and reporting
Every data set had an owner and a steward at each site. Weekly automatic checks flagged doubtful records, classification was done by safety leads and sampled centrally, and each site reconciled its records quarterly. Hours came from a single timekeeping export, including agency hours, with a log of corrections.
Reporting followed a calendar. Crews and supervisors saw daily and weekly area information. Site leadership teams reviewed all fourteen indicators monthly with the joint occupational health and safety committee co-chairs present. The executive team reviewed the company report monthly. The board committee received the two-page report quarterly and visited a site before each meeting. Workers saw a monthly summary on the site boards. Once a year, the management review examined the whole framework and decided what to change.
The first year's results
Elena insisted that the first-year review apply the same honesty to the framework's own results as the framework applied to everything else. The injury rate had fallen. The question was whether that fall meant anything.
# Year-one review: did the recordable rate really fall, and what moved?
import math
before = (33, 1_216_000)   # baseline year: cases, hours
after = (27, 1_238_000)    # first year of the framework
rate = lambda k, h: k * 200_000 / h
print(f"recordable rate: {rate(*before):.2f} -> {rate(*after):.2f}")

# Given 60 cases in total, how often would 27 or fewer fall in year one
# if both years had the same underlying rate? (conditional binomial test)
n = before[0] + after[0]
p = after[1] / (before[1] + after[1])
p_low = sum(math.comb(n, k) * p**k * (1 - p)**(n - k) for k in range(after[0] + 1))
print(f"chance of a fall this large or larger with no real change: {p_low:.2f}")

leading = [
    # indicator, baseline, year one, higher is better?
    ("lockout verifications passed %",      81, 96, True),
    ("forklift separation checks passed %", 84, 97, True),
    ("SIFp events investigated in 10 days %", 52, 91, True),
    ("high-risk findings overdue (count)",  23,  4, False),
    ("corrective actions closed on time %", 61, 86, True),
    ("near misses per 100 workers, distribution", 13, 41, True),
]
for name, b, a, hb in leading:
    better = (a > b) == hb
print(f"{name:<44}{b:>5} -> {a:<5}{'better' if better else 'worse'}")recordable rate: 5.43 -> 4.36 chance of a fall this large or larger with no real change: 0.24 lockout verifications passed % 81 -> 96 better forklift separation checks passed % 84 -> 97 better SIFp events investigated in 10 days % 52 -> 91 better high-risk findings overdue (count) 23 -> 4 better corrective actions closed on time % 61 -> 86 better near misses per 100 workers, distribution 13 -> 41 better
The recordable rate fell from 5.43 to 4.36. But the test showed that a fall of that size or larger would happen about one time in four with no real change in risk. Elena told the committee plainly that the injury numbers alone could not show that the company was safer. A director asked whether that meant the year's work had failed. Elena's answer was that the injury rate was the wrong place to look for proof after one year, as Lessons 3 and 10 had shown, and that the evidence lay elsewhere.
The leading indicators had all moved strongly in the right direction. Lockout verification pass rates rose from 81 to 96 percent, and forklift separation checks from 84 to 97 percent. The share of SIF-potential events investigated within ten days rose from 52 to 91 percent. Overdue high-risk findings fell from 23 to 4. Near-miss reporting at Dartmouth more than tripled. There were no serious injuries in the year, which Elena also refused to claim as proof, since two serious injuries a year had been the baseline and a year with none is not unusual at that frequency.
The audits gave the strongest evidence. The second round of lockout audits at Truro found individual locks in use on every night lockout observed, procedures matching equipment in a random sample of 46, and periodic reviews up to date. The forklift audit at Dartmouth found physical separation in every staging lane and current practical evaluations for every agency driver sampled. These were the controls whose failure had caused the two serious injuries in the baseline year.
What did not work
The review also listed what had not worked. Three indicators had been dropped or changed. Training hours completed had been in the first draft and was dropped because it could not be linked to any control. The near-miss indicator had been gamed at one department, where a supervisor had asked each worker to submit one report a week, producing dozens of trivial reports; the paired indicator, the share of near misses with a recorded action, revealed it, and the department's target was removed. And the pulse survey question on stopping unsafe work had been answered by fewer than a third of night workers, so the survey was moved to paper forms handed out at shift start.
Some problems remained. The guarding indicator at Truro was still amber at year end. The Kentville plant had too few events to make its own control charts useful, so it was reported with the company charts. And the maintenance team was still stretched, which showed up in the response indicators every month. The committee approved a second maintenance planner and asked for a deep-dive on guarding at its next meeting.
Worked problem
Testing the framework against a new hazard
Show solution
- Six weeks after the review, the company approved a robotic palletizer for the Dartmouth site. Elena used it to test whether the framework handled change.
- Through management of change, the palletizer was added to the hazard register as a serious hazard, with two critical controls: the safety-rated fencing and interlocks, and lockout for maintenance and jam clearing.
- Two new verification checks were written, the inspection route at Dartmouth gained a high-risk point, and the next year's audit program added a robotics topic audit with an initial frequency of six months because of the change.
- The board report's critical control section gained a line for the palletizer, starting from the first month of operation.
Answer: The framework absorbed the new hazard through its existing parts: management of change fed the hazard register, which fed indicators, verifications, inspections, audits and reports.
Keeping the framework alive
Measurement frameworks decay. Indicators that once revealed problems become routine, people learn how to make them look good, and new hazards arrive without new indicators. Elena built five habits into the procedure to slow the decay: an annual review of every indicator against the qualities in Lesson 1; a rule that any indicator at 100 percent for a year is redefined or retired; a review of every serious event and SIF-potential event to ask whether the indicators had warned of it; paired inspections and audit calibration twice a year; and a standing item at every joint occupational health and safety committee meeting asking whether the numbers matched what workers saw.
At the end of the meeting, Margaret Doyle asked Rachel the question that had started the project: 'If this report were all green, would it tell us anything we needed to know?' Rachel's answer was that it would tell them which serious hazards had been checked, how, and with what result, and that if it were all green, she would ask the audit team to look harder. Margaret said that was the answer she had been waiting eighteen months to hear.
Applying the capstone to your own workplace
The details of Harrowgate Foods Ltd.'s framework fit a three-site food manufacturer. Yours will differ. A construction firm will have different serious hazards and a moving workforce; a hospital will measure patient handling and violence; a small business may have too few hours for any rate to mean much. The method transfers even when the details do not. Start from the hazards that could kill or seriously injure someone, define the controls that prevent them, decide how you will know whether those controls are working, test that evidence through audits, keep the data honest, and report it in a way that leads to decisions. Then review the whole thing every year and be candid about what did not work.
Common mistakes
MistakeClaiming success from a single year's fall in injuries.
InsteadTest whether the change is larger than chance and look to leading indicators and audits for evidence.
MistakeBuilding indicators, inspections, audits and reports as separate projects.
InsteadConnect them in one framework centred on serious hazards and critical controls.
MistakeHiding indicators that did not work.
InsteadReport what was dropped or changed and why.
MistakeTreating the framework as finished.
InsteadReview indicators annually and retire or redefine those that no longer reveal anything.
MistakeAdding new equipment without new measures.
InsteadUse management of change to add hazards, controls, verifications and audits.
Summary and key terms
- A safety performance framework connects indicators, inspections and verifications, audits, data governance, and reporting and review.
- Every part should trace back to serious hazards and their critical controls.
- Indicators need specifications, thresholds and owners, and none should be tied to individual bonuses.
- A one-year fall in injury rates is often within chance, so evidence of improvement comes from leading indicators and audits.
- Honest reviews report indicators that failed or were gamed and the changes made.
- Frameworks decay unless they are reviewed, recalibrated and updated through management of change.
- Safety performance framework
- The connected set of indicators, inspections, audits, data rules and reporting used to manage safety performance.
- Management review
- A periodic review by top management of the safety management system and its performance.
- Deep-dive
- A detailed board or executive review of one topic, such as guarding.
- Calibration
- Checking that inspectors and auditors judge similar evidence in the same way.
- Conditional binomial test
- A test of whether two injury rates differ, based on how the total cases split between the periods.
Practice problems
Work each problem on paper first, then reveal the answer to check.
Name the five parts of the framework.
Show answer
Indicators, inspections and verifications, the audit program, data governance, and reporting and review.
Why did Elena refuse to claim the fall from 5.43 to 4.36 as proof of improvement?
Show answer
A fall that large or larger would happen about one time in four with no real change in risk.
What evidence did the audits give in year one?
Show answer
Individual locks on every observed night lockout, procedures matching equipment in a random sample of 46, up-to-date reviews, and full forklift separation and evaluations at the distribution site.
How was the gamed near-miss indicator detected?
Show answer
Through the paired indicator, the share of near misses with a recorded action.
What happens to an indicator that sits at 100 percent for a year?
Show answer
It is redefined or retired.
Lesson quiz · 5 questions
Score 60% or more to complete this lesson.
Create a free account to save your progress, take quizzes and earn a certificate.