
HSE-407 · Lesson 1 of 12 · 22 min
Why measure safety performance
Every spring, the board of directors of Harrowgate Foods Ltd. received a safety report. It was one page long and had been laid out the same way for six years. At the top sat the company's total recordable injury frequency (TRIF), which had fallen from 6.1 to 5.4 recordable injuries per 200,000 hours worked. Below it was a row of green circles, one for each site, and a line that read: 'Kentville sauces plant: 412 days without a lost-time injury.' The directors thanked the operations team and moved on to the capital plan.
Rachel Okoye, the vice-president of operations, had sat through that meeting with growing discomfort. In the same twelve months that the report showed as a success, a night sanitation worker at the Truro plant had had his forearm caught in a running spiral conveyor, and an agency forklift driver at the Dartmouth distribution centre had reversed into a picker and broken her ankle and foot. Both injuries were in the numbers, but the numbers gave no hint of how close either event had come to a death, or of the lockout shortcuts and blind staging lanes that the investigations later found had been in place for months.
After the meeting, Rachel asked Elena Novak, the company's health and safety manager, a direct question: 'If that report had been red instead of green, would it have told us anything we needed to know?' Elena's honest answer was no. The report counted harm after it had happened. It said nothing about whether the controls that prevent serious harm were in place and working. This course follows Elena, Rachel and their colleagues over the following eighteen months as they rebuild how Harrowgate Foods Ltd. measures, audits and reports on safety.
What measurement is for
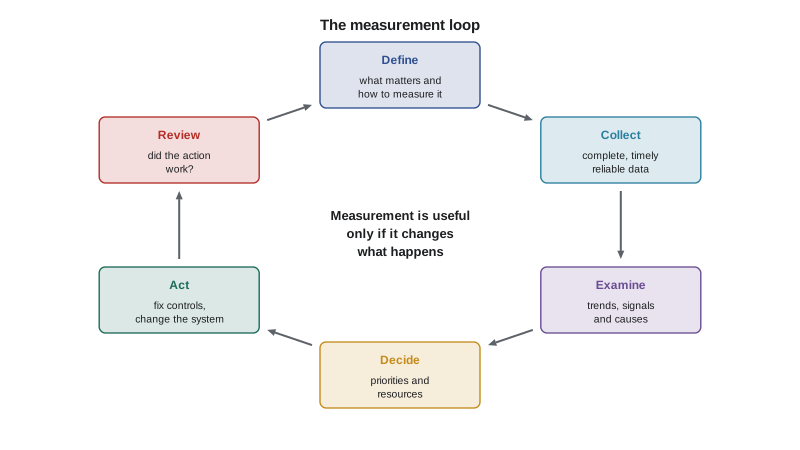
Safety measurement is not an end in itself. A company measures safety performance so that it can make better decisions about where to spend effort and money, and so that it can tell whether the things it is doing are working. Elena listed four purposes when she began, and the rest of the course keeps coming back to them:
- To know whether controls are working. Guards, lockout, traffic separation, ammonia detection and training only protect people if they are present, used and effective. Measurement should show which controls are weak before an injury shows it.
- To learn and improve. Data should help the company find patterns, test ideas and see whether changes made a difference.
- To decide. Managers and directors must choose among competing priorities. Good measures show where risk is highest and where an extra dollar or hour will do the most good.
- To account. Workers, regulators, customers, insurers and directors all have a legitimate interest in how the company manages safety. Measures give them evidence rather than reassurance.
A one-page report of injury counts serves the fourth purpose poorly and the first three hardly at all. That does not mean injury numbers are useless. They are the most direct evidence of harm, and Lesson 2 shows how to calculate them properly. But they arrive late, they are driven partly by chance, and they say little about the rare, severe events that matter most.
The language of indicators
Writers on safety measurement use several overlapping terms. This course uses the following, which match the way most standards and guidance documents use them:
- A metric or measure is any quantity that is counted or calculated, such as hours worked, inspections completed or injuries recorded.
- An indicator is a measure chosen because it tells you something about performance that you care about. Not every measure is a useful indicator.
- A lagging indicator measures outcomes after the fact: injuries, illnesses, lost days, claims costs, property damage and regulatory orders.
- A leading indicator measures the conditions, activities and behaviours that are expected to prevent those outcomes: inspections done, hazards fixed, critical controls verified, training completed, near misses reported and acted on.
- A target is the value the company aims for. A threshold is the value that triggers a defined response.
The split between leading and lagging is useful but not perfect. A near miss is an outcome of something that has already gone wrong, yet it gives early warning of a potential injury. A failed lockout verification is a lagging measure of the lockout process and a leading measure of amputation risk. Elena found it more helpful to ask of each measure: how early does it warn us, and how directly does it relate to serious harm?
Where measurement sits in a safety management system
In HSE-404, Harrowgate Foods Ltd. built a safety management system on the plan-do-check-act cycle. Measurement is the 'check' step. ISO 45001, the international standard the company follows together with CSA Z45001, requires an organization to decide what needs to be monitored and measured, the methods it will use, the criteria it will judge performance against, and when results will be analysed, evaluated and communicated. It also requires internal audits at planned intervals and a management review by top management.
Those requirements are short, but they carry a demanding idea. A company is expected to decide in advance what it will look at and what will count as good or poor performance, rather than gathering whatever data happens to be available and deciding afterwards what it means. The standard also expects the results to be used. If monitoring shows that a control is weak and nothing happens, the system has failed even if the monitoring itself was perfect.
Audits, covered in Lessons 7 and 8, are a particular kind of measurement. An inspection looks at conditions and practices at a point in time. An audit asks whether a whole system, such as lockout or contractor management, is designed properly, is being followed and is achieving its purpose. Inspections and audits produce leading indicators of their own, such as the number of high-risk findings and how quickly they are closed.
What gets measured gets managed
Managers often repeat the saying 'what gets measured gets managed' as if it were wholly good news. Elena reminded the leadership team that it cuts both ways. When a number becomes a target, especially one linked to pay or reputation, people work on the number. Sometimes they do this by improving the thing the number was meant to reflect. Sometimes they find easier ways to move the number. The economist Charles Goodhart gave his name to the observation that a measure used as a target tends to stop being a good measure, and safety offers many examples.
Harrowgate Foods Ltd. had one already. In HSE-401, the Dartmouth site had a quarterly bonus that was paid only if there were no lost-time injuries. Reporting of minor injuries fell, workers with sprains were encouraged to come in and sit in the break room rather than stay home, and the site's rate looked excellent while its forklift traffic problems went unaddressed. The bonus was redesigned, but the lesson stayed with Elena: every indicator in the new framework had to be tested against the question, 'How could someone make this look better without making anyone safer?'
Chance and small numbers
A second problem with injury counts is that they are noisy. Even if conditions at a site stay exactly the same, the number of recordable injuries will rise and fall from year to year purely by chance. At a site with a few injuries a year, a change from three to six or from six to three can easily happen with no change in risk at all. The board of directors had been reading meaning into movements that were mostly noise.
# Simulate ten years at a plant whose true risk never changes
import random
random.seed(407)
hours = 860_000          # hours worked per year, constant
true_rate = 5.0          # recordables per 200,000 hours, constant
expected = true_rate * hours / 200_000
print(f"expected recordables per year: {expected:.1f}")
for year in range(1, 11):
    # count events: each of many small exposures has a tiny chance of an injury
    n = sum(1 for _ in range(100_000) if random.random() < expected / 100_000)
    rate = n * 200_000 / hours
    bar = "#" * n
print(f"year {year:2d}: {n:2d} recordables, rate {rate:4.2f} {bar}")expected recordables per year: 21.5 year 1: 23 recordables, rate 5.35 ####################### year 2: 15 recordables, rate 3.49 ############### year 3: 21 recordables, rate 4.88 ##################### year 4: 26 recordables, rate 6.05 ########################## year 5: 27 recordables, rate 6.28 ########################### year 6: 20 recordables, rate 4.65 #################### year 7: 15 recordables, rate 3.49 ############### year 8: 22 recordables, rate 5.12 ###################### year 9: 22 recordables, rate 5.12 ###################### year 10: 25 recordables, rate 5.81 #########################
The simulation holds the true risk fixed for ten years. The observed rate still swings from about 3.5 to above 6.2. A director who saw the rate fall from 6.28 in year five to 3.49 in year seven might praise the plant manager, and a director who saw it climb back to 5.81 by year ten might ask for a new safety program, when in both cases nothing real had changed. Lesson 10 shows how to tell real change from chance using confidence intervals and control charts. For now, the point is simpler: a single year-on-year comparison of injury rates is weak evidence of anything.
Serious harm follows different patterns
The third problem is the one that worried Rachel most. Most recordable injuries at a food plant are strains, cuts, bruises and minor burns. They matter, and they cost money and pain, but they are not usually caused by the same failures that cause deaths and life-changing injuries. Serious injuries and fatalities tend to involve high energy, such as moving machinery, vehicles, falls from height, stored pressure and hazardous chemicals, and a failure of a specific control that was meant to manage that energy.
A company can drive its minor injury rate down with ergonomic changes, better gloves and housekeeping while its serious injury risk stays the same or grows. Lesson 3 looks at the evidence for this and at famous cases where low injury rates sat alongside catastrophic risk. Lesson 4 introduces the indicators Harrowgate Foods Ltd. chose to watch serious injury precursors directly.
Worked problem
Reading the old board report
Show solution
- Elena took the report the board of directors had received and asked three questions of each line: what does it measure, how early does it warn, and does it relate to serious harm?
- The total recordable injury frequency (TRIF) measured all recordable injuries, warned only after harm, and was dominated by minor cases. The 'days without' line for Kentville measured the time since the last lost-time injury at a site with about 60 workers, where a long run was likely by chance alone.
- The green circles had no written definition. When Elena asked the site managers what made a circle green, she got three different answers.
- Nothing in the report described lockout, forklift traffic, ammonia, guarding, contractors or any other control linked to serious harm, and nothing showed whether the actions from past investigations had been completed.
Answer: The report measured harm late, mixed signal with chance, had no definitions and was silent on the controls that prevent serious harm. It reassured the board without informing it.
The project
Rachel took Elena's analysis to the chief executive, Richard Lam, and then to the board of directors's safety and operations committee, chaired by Margaret Doyle. Margaret had spent twenty years in the airline industry before joining the board and was blunt about what she wanted: 'I don't want a prettier report. I want to know whether the things that could kill someone are under control, and I want to know before something happens, not after.'
The committee approved an eighteen-month project with four parts. First, a review of the lagging indicators, so that what the company counted was defined and calculated consistently. Second, a small set of leading indicators focused on serious injury precursors and critical controls. Third, a rebuilt inspection and audit program that produced reliable evidence. Fourth, new reporting to site leaders, executives and the board. Nina Castillo, a data analyst in the finance team, was assigned to the project part-time, and Aisha Rahman, the quality manager who ran the company's food safety audits, agreed to help design the audit program.
Elena also insisted that workers be involved from the start. The co-chairs of the joint occupational health and safety committees, Tanya Morris at Truro and Sam Pellerin at Dartmouth, joined the working group. Their first contribution was to point out that workers already knew which hazards worried them most, and that any indicator that did not reflect those hazards would be ignored on the floor.
What good measurement looks like
By the end of the first month, the working group had agreed on a short list of qualities that every part of the new framework should have. The list became a checklist used throughout the project:
- Relevant: linked to the hazards and controls that matter most, especially those that could cause serious harm.
- Defined: each indicator has a written definition, formula and data source, so that two people calculating it would get the same answer.
- Reliable: the data are complete and accurate, and the way they are collected does not change without notice.
- Timely: results arrive soon enough to act on.
- Actionable: each indicator has an owner and a defined response when it crosses a threshold.
- Resistant to gaming: the indicator is hard to improve without improving safety, and it is paired with other measures that would show manipulation.
- Understood: the people who report and use it know what it means and what it does not mean.
None of this required expensive software. Nina's first prototype ran on a spreadsheet and a few short scripts like the ones in this course. What it required was clear thinking about what to measure, discipline about definitions, and a willingness to act on what the numbers showed.
Common mistakes
MistakeTreating a falling injury rate as proof that safety is improving.
InsteadCheck whether the change is larger than chance and whether serious injury risk has also changed.
MistakeReporting only lagging indicators to leadership.
InsteadPair outcome measures with leading indicators on critical controls and corrective actions.
MistakeCollecting whatever data is easy and deciding later what it means.
InsteadDecide in advance what to measure, how, against what criteria and who will act.
MistakeLinking bonuses to injury counts.
InsteadReward activities and quality that prevent harm, and watch for under-reporting.
MistakeUsing status colours without written definitions.
InsteadDefine every threshold so the same data always produce the same colour.
Summary and key terms
- Safety measurement exists to show whether controls work, to learn, to support decisions and to account to others.
- Lagging indicators measure harm after the fact; leading indicators measure the conditions and activities that prevent it.
- ISO 45001 requires organizations to decide in advance what to monitor, how, against what criteria, and when to analyse and communicate results.
- Measures used as targets can be gamed, so every indicator should be tested for ways to improve it without improving safety.
- Injury counts at a single site vary widely by chance, so year-on-year comparisons are weak evidence.
- Serious injuries often follow different causes from minor ones, so minor injury rates can fall while serious risk remains.
- Lagging indicator
- A measure of harm or loss after it has occurred, such as injuries, lost days or claims.
- Leading indicator
- A measure of the conditions, activities or behaviours expected to prevent harm.
- Target
- The value of an indicator that the organization aims to reach.
- Threshold
- The value of an indicator that triggers a defined response.
- Goodhart's law
- The observation that a measure used as a target tends to lose its value as a measure.
Practice problems
Work each problem on paper first, then reveal the answer to check.
Name the four purposes of safety measurement Elena listed.
Show answer
To know whether controls are working, to learn and improve, to decide, and to account to others.
Why is a near miss hard to classify as purely leading or lagging?
Show answer
It is the outcome of something that went wrong, but it warns of a possible injury before one happens.
What does ISO 45001 require an organization to decide about monitoring?
Show answer
What to monitor and measure, the methods, the criteria for judging performance, and when results are analysed, evaluated and communicated.
Why was the 412 days without a lost-time injury line weak evidence?
Show answer
At a small site a long run without such an injury is likely by chance, and it says nothing about controls for serious harm.
What question did Elena ask of every proposed indicator to test it for gaming?
Show answer
How could someone make this look better without making anyone safer?
Lesson quiz · 5 questions
Score 60% or more to complete this lesson.
Create a free account to save your progress, take quizzes and earn a certificate.