
HSE-403 · Lesson 9 of 12 · 22 min
Root cause methods II: causal factor charts, fault trees and barrier analysis
The fishbone and the why-chains had given the team a long list of causes and a sense of which ones mattered most. What they did not yet show clearly was how the causes fitted together in time, which defences had been in place and how each one had failed, and whether fixing any single cause would have been enough. For those questions, Elena turned to three more structured tools: a causal factor chart, a simple fault tree, and a barrier analysis that she later drew as a bowtie diagram.
These methods take more time than the five whys, and they are usually reserved for level 3 investigations, complex events, or incidents where the team suspects that several defences failed at once. They have a long history in high-hazard industries such as nuclear power, aviation and chemical processing, where investigators learned that simple chains miss how failures interact. This lesson introduces each one at a practical level.
Causal factor charting
A causal factor chart, often called an events and causal factors chart, ties the analysis to the timeline from lesson 5. It grew out of methods developed for the US nuclear and energy sectors in the 1970s and 1980s and is now used widely. The chart has a main line of events, drawn as rectangles in time order from left to right, ending in the incident. Above and below the line, conditions that influenced each event are drawn as ovals and linked to the event they affected. Conditions can link to other conditions further back. Finally, the team marks causal factors: the events or conditions that, if removed, would have prevented the incident or made it less severe.
The rules are simple but strict. Each event should describe a single action or happening, with a noun and an active verb: 'driver reverses truck out of lane 14S', not 'reversing'. Events should be based on evidence; anything assumed is drawn with a dashed outline. Conditions describe states, not actions: 'walkway blocked by pallet stack', 'blue light failed'. And the chart should keep going back in time until it reaches the decisions and processes that created the conditions.
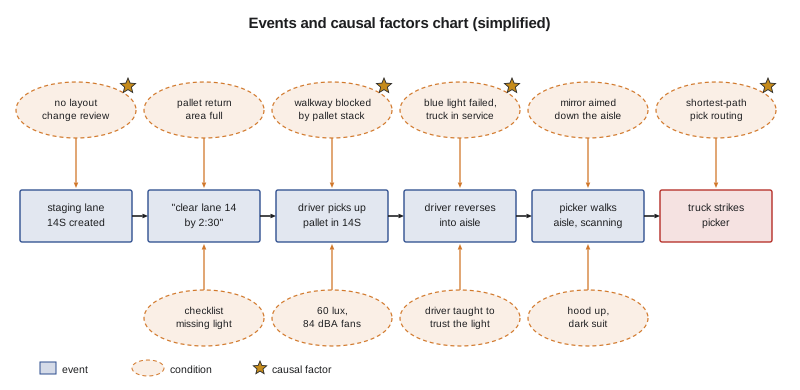
Building the chart for aisle 14 took most of a morning. The main line had eleven events, starting five weeks before with 'Derek emails proposal for temporary staging lane 14S' and 'Grace approves by email', running through the dispatcher's message and the moment Jordan began to reverse, and ending at the impact. The conditions filled the space above and below. The team marked four causal factors, each one an answer to the question 'if this had not been true, would the collision still have happened?'
- The staging lane opening directly into a pick route, created without review. Without it, there would have been no reversing truck at that spot.
- The walkway blocked by the pallet stack. Without it, Marie would have been on the walkway, and Jordan's sightline to the left would have been clear.
- The failed blue light kept in service. With a working light, Marie would very likely have seen the dot and stopped.
- The pick routing that sent pickers past the lane exit repeatedly. With a route that avoided the exit, exposure would have been far lower.
The test is a thought experiment, and it is not perfect: nobody can be certain what would have happened. But it disciplines the team to separate causal factors from background conditions. The fan noise, the lighting and the dark suits all made the collision more likely, and they went into the report as contributing factors. But on their own, removing any one of them would probably not have prevented it.
Fault tree basics
A fault tree works backwards from an undesired event, called the top event, using logic gates to show which combinations of lower-level events could cause it. An OR gate means the event above happens if any one of the events below happens. An AND gate means the event above happens only if all of the events below happen together. The tree continues down until it reaches basic events that need no further breakdown. Fault trees were developed in the early 1960s for missile launch control systems and later became standard in aerospace, nuclear and chemical safety.
Fault trees are often used before anything goes wrong, to estimate how likely a hazardous event is and which failures matter most. In an investigation, a simple qualitative tree, without numbers, helps a team check its logic. For aisle 14, the top event was 'reversing forklift strikes pedestrian at staging lane exit'. That required, through an AND gate, three things at once: a forklift reversing out of the lane, a pedestrian in its path, and both warnings failing to prevent contact. The warnings branch was itself an AND: the driver failed to see the pedestrian, and the pedestrian failed to detect the truck. Each of those had OR gates below it: the driver could fail to see because of the blocked sightline, the mirror's angle or attention on the other side; the pedestrian could fail to detect because the blue light failed, the alarm was masked by noise, or attention was on the scanner.
The tree showed something the fishbone had not. Because the top event needed several things at once, removing any one branch of the AND gate would have prevented the collision. That is good news for prevention: it means the company did not need to fix everything to protect people, as long as it fixed at least one AND branch reliably. But it also explained why the collision had not happened earlier. For weeks, all three branches had to line up on the same few seconds, and twice they nearly did.
Putting rough numbers on a tree
Numbers in a fault tree built after an incident are always rough, and Elena is careful never to present them as precise. But a rough calculation can show which changes reduce the risk most. Luis built a simple version with illustrative values per reversing movement out of the lane, to compare options.
# Illustrative probabilities per reversing movement out of lane 14S (not measured values).
def OR(*p):           # probability that at least one event occurs (assumes independence)
    q = 1.0
    for x in p:
        q *= (1 - x)
    return 1 - q
def AND(*p):          # probability that all events occur together (assumes independence)
    r = 1.0
    for x in p:
        r *= x
    return r

def top(pedestrian_in_path, light_failed, alarm_masked, pick_attention,
        sightline_blocked, mirror_wrong, other_side_focus):
    ped_misses_truck = AND(OR(light_failed, 0.05), OR(alarm_masked, pick_attention))
    driver_misses_ped = OR(sightline_blocked, mirror_wrong, other_side_focus)
    return AND(pedestrian_in_path, ped_misses_truck, driver_misses_ped)

base = dict(pedestrian_in_path=0.02, light_failed=1.0, alarm_masked=0.7, pick_attention=0.6,
            sightline_blocked=0.9, mirror_wrong=1.0, other_side_focus=0.5)
options = {
    "as found": {},
    "light working and checked": {"light_failed": 0.0},
    "walkway cleared": {"pedestrian_in_path": 0.004, "sightline_blocked": 0.1},
    "lane exit barrier, no pick route": {"pedestrian_in_path": 0.0002},
}
for name, change in options.items():
    p = top(**{**base, **change})
print(f"{name:<34} {p:.5f} about 1 in {1 / p:,.0f}" if p else f"{name:<34} 0")as found 0.01760 about 1 in 57 light working and checked 0.00088 about 1 in 1,136 walkway cleared 0.00352 about 1 in 284 lane exit barrier, no pick route 0.00018 about 1 in 5,682
With these illustrative values, the reversing movements as found carried roughly a 1 in 60 chance of a strike whenever they happened, and the lane handled dozens of movements a night, which matches the two near misses and one collision in five weeks. Fixing the light alone cut the chance by about twenty times. Clearing the walkway helped too, by about five times. Separating the lane exit from the pick route with a barrier and moving the pick route cut it by about a hundred times. The numbers are made up, and Luis labelled them that way, but the ranking they show is robust: physical separation beats warnings, and warnings that can fail silently need regular checks.
Barrier analysis
Barrier analysis asks a different question from the methods so far. Instead of 'what caused this?', it asks 'what should have stopped it, and why didn't it?' A barrier, sometimes called a control or a defence, is anything intended to prevent a hazard from causing harm or to reduce the harm. Barriers can be physical, such as guards, rails and separation; technical, such as warning lights, alarms and interlocks; procedural, such as rules and checklists; or human and organizational, such as training, supervision and change review.
For each barrier, the team records what it was meant to do, whether it was present, and how it performed. Investigators commonly use four outcomes. A barrier can be missing: it should have existed but did not. It can be failed: it existed but did not work. It can be ineffective: it worked as designed, but the design did not cope with the situation. Or it can be bypassed: people worked around it, often for good reasons.
- Physical separation of pedestrians and trucks at the lane exit: missing; the staging lane opened directly into the pick route.
- Painted pedestrian walkway: bypassed; blocked by pallets, so everyone walked in the travel aisle.
- Blue warning spotlight: failed; corroded connector, not detected, truck kept in service.
- Reversing alarm: ineffective; worked, but masked by fan noise and hoods.
- Convex mirror: ineffective; frosted, and aimed to show the travel aisle, not the lane exit.
- Pre-use checklist: ineffective; no line for the light.
- High-visibility clothing: missing; vests did not fit freezer suits and no alternative was provided.
- Driver practical evaluation: missing; required by procedure but not done.
- Near-miss reporting and follow-up: ineffective; reports made but closed with reminders.
- Management of change: missing for warehouse layouts.
The analysis showed ten barriers, none of which worked fully that night. Some had failed recently, like the light. Others had never been there, like separation at the lane exit. Barrier analysis is especially good at showing over-reliance on weak barriers. On the night of the collision, the only barriers between Marie and the truck that were fully present and working were two people's attention, and attention is exactly what night shifts, cold, noise and task screens wear down.
The bowtie diagram
A bowtie diagram combines a fault tree on the left with an event tree on the right, around a central event. The centre of the bowtie is the top event, usually defined as the moment control of a hazard is lost: here, 'reversing forklift and pedestrian in the same space'. On the left are the threats that can lead to it, each with the prevention barriers that should stop it. On the right are the consequences that can follow, each with the mitigation barriers that should limit harm, such as speed limits, emergency stop, first aid and emergency response. Factors that weaken barriers, called escalation factors, can be added to each barrier.
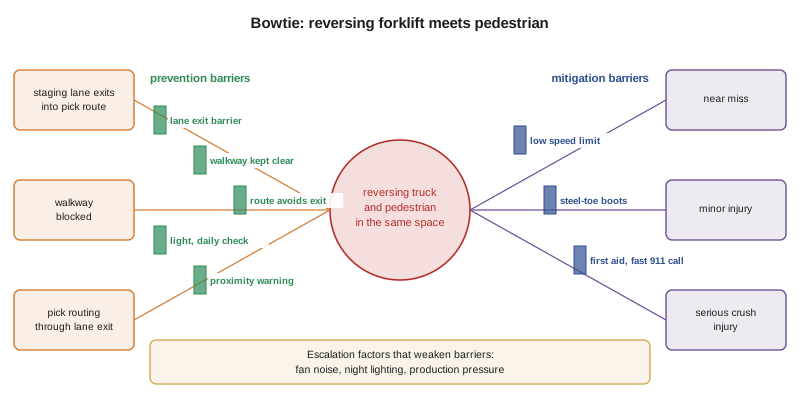
Bowties have become popular because they are easy to read for people who were not in the investigation, and because they link an incident back to the site's risk assessments. After aisle 14, Elena used the bowtie to review the distribution centre's risk assessment for forklift and pedestrian interaction. The original assessment listed training, the walkway, the alarm and the mirror as controls. It did not mention the blue light, which had been added later, and it did not consider staging lanes at all, because they had not existed when it was written. The bowtie became the basis of the revised assessment.
Choosing a method
No method is right for every investigation. For a level 1 review, a short five whys is usually enough. For a level 2 investigation, a fishbone followed by branched whys works well. For a level 3 investigation, a causal factor chart, a barrier analysis and a bowtie are usually worth the effort, often alongside a fishbone. Many organizations also use commercial root cause systems with their own trees of standard cause categories; these can help consistency, as long as teams do not simply pick from a list without evidence. Whatever the method, the same principles apply: base every link on evidence, look at every level of the organization, and finish with causes that can be fixed.
Worked problem
A quick barrier analysis
Show solution
- Incident at the Truro plant: a worker's sleeve is caught by an exposed shaft end on a conveyor; the sleeve tears and the worker is unhurt.
- Guard over the shaft end: missing; removed during a repair three weeks ago and not replaced.
- Restart check after maintenance: ineffective; the checklist covers interlocked guards but not fixed covers.
- Rule on loose clothing: bypassed; the worker had unbuttoned a cuff because the area is hot in summer.
- Supervision walk-through: missing on that line for two weeks because of a vacancy. Fixes target the guard, the restart checklist and the heat.
Answer: List each barrier, classify it as missing, failed, ineffective or bypassed, and fix the barriers rather than the worker.
Common mistakes
MistakeDrawing events as vague states such as 'reversing' or 'unsafe area'.
InsteadWrite each event as one action with a noun and an active verb, based on evidence.
MistakeMarking every condition on the chart as a causal factor.
InsteadUse the 'would it still have happened?' test to separate causal factors from contributing conditions.
MistakePresenting post-incident fault tree numbers as precise.
InsteadLabel them illustrative and use them only to compare options.
MistakeListing only the barriers that were in the written risk assessment.
InsteadInclude barriers that should have existed and ones added since the assessment.
MistakeRelying on warnings and attention as the main defences.
InsteadPrefer physical separation, and check warnings that can fail silently.
Summary and key terms
- Causal factor charts link conditions to a timeline of events and mark the factors that, if removed, would have prevented the incident.
- Fault trees use AND and OR gates to show how combinations of events lead to a top event.
- Removing any branch of an AND gate prevents the top event; rough numbers can rank options but must be labelled illustrative.
- Barrier analysis lists each defence and whether it was missing, failed, ineffective or bypassed.
- Bowtie diagrams show threats, prevention barriers, the top event, mitigation barriers, consequences and escalation factors.
- Choose methods to fit the investigation level, but always base links on evidence and finish with fixable causes.
- Events and causal factors chart
- A chart linking conditions to a timeline of events, with causal factors marked.
- Causal factor
- An event or condition that, if removed, would have prevented the incident or reduced its severity.
- Fault tree
- A diagram working back from a top event using AND and OR logic gates.
- Barrier
- Anything intended to prevent a hazard from causing harm or to limit the harm.
- Bowtie diagram
- A diagram with threats and prevention barriers on the left and consequences and mitigation barriers on the right of a central event.
- Escalation factor
- A condition that weakens a barrier.
Practice problems
Work each problem on paper first, then reveal the answer to check.
How are events and conditions drawn on a causal factor chart?
Show answer
Events as rectangles on a time-ordered line, conditions as ovals linked to the events they influenced.
What test identifies a causal factor?
Show answer
Asking whether the incident would still have happened if the event or condition had not been present.
What did the AND gate in the fault tree show?
Show answer
All three branches had to occur together, so reliably removing any one would prevent the collision.
Name the four barrier outcomes.
Show answer
Missing, failed, ineffective and bypassed.
What sits in the centre of a bowtie diagram?
Show answer
The top event, the moment control of the hazard is lost.
Lesson quiz · 5 questions
Score 60% or more to complete this lesson.
Create a free account to save your progress, take quizzes and earn a certificate.