
GEOM-320 · Lesson 3 of 12 · 22 min
Sensors and platforms
With the field spectra in hand, Leah had to choose where the images would come from. The board had a modest budget and wanted products every two weeks in summer, a crop map each autumn, monthly measurements of the coulee banks and rapid maps during emergencies. Theo had already registered the firm with the main free data portals, and two commercial suppliers had sent price lists. This lesson describes the platforms that carry sensors, the orbits that determine when and how often they see a place, the ways sensors build images, and the missions available to the district's program, from free government satellites to commercial constellations, aircraft and drones.
Platforms
Sensors are carried by satellites, crewed aircraft, drones and ground or mast installations. Each platform trades coverage against detail, cost, flexibility and dependence on weather. Satellites cover large areas repeatedly at low or no cost to the user, but at fixed times and with spatial detail limited by their altitude. Crewed aircraft can carry large sensors such as hyperspectral imagers and lidar, fly under high cloud, and choose the date and time, but each mission is expensive and must be planned and permitted. Drones give centimetre detail over small areas, as in the headworks surveys of the photogrammetry course, but are limited by flight endurance and by the rules on flying out of sight. Fixed cameras and spectral sensors on masts give continuous records at one spot and are useful for calibrating satellite products, for example a phenology camera looking at one alfalfa field all season.
Orbits
Most Earth observation satellites fly in low Earth orbit, between about 400 and 900 km, where the orbital period is 90 to 103 minutes. The period of a circular orbit follows from Kepler's third law, \(P = 2\pi\sqrt{a^3/GM}\), where \(a\) is the orbital radius and \(GM = 3.986 \times 10^{14}\) m³/s². Most land imaging satellites use near-polar sun-synchronous orbits, inclined about 98° to the equator. The Earth's equatorial bulge causes the orbit plane to precess, and at that inclination the precession is exactly one revolution per year, so the satellite crosses each latitude at the same local solar time every day. Landsat and Sentinel-2 cross the equator southbound in the mid-morning, at about 10:00 to 10:30 local time, a compromise between the haze and low sun of early morning and the cumulus clouds that build up over the prairies in the afternoon. Constant overpass time keeps the illumination similar from one date to the next, apart from the seasonal change in sun elevation.
Geostationary satellites orbit at about 35,786 km above the equator with a period of one sidereal day, so they stay over the same point and can image the same hemisphere every few minutes. They are the platform of weather satellites, which now carry imagers with visible, near infrared and thermal bands at 0.5 to 2 km resolution and are increasingly used for land applications that need high frequency, such as detecting new fires and tracking smoke. At the latitude of the service area, about 50° N, a geostationary satellite views the ground at a steep angle, so pixels are elongated and larger than at the equator.
Other orbits serve particular purposes. The International Space Station's inclined orbit carries instruments such as thermal and lidar sensors that view the ground at different times of day, which is valuable for studying the daily cycle of crop temperature. Constellations of small satellites in several orbital planes trade per-satellite capability for frequency: one commercial constellation images nearly all land every day at about 3 m resolution.
import math
GM = 3.986004418e14      # m3/s2
R = 6371000.0            # mean Earth radius, m
sats = [  # name, altitude km, swath km, number of satellites in the constellation
    ("Landsat 8/9", 705.0, 185.0, 2),
    ("Sentinel-2", 786.0, 290.0, 2),
    ("Sentinel-1 (IW mode)", 693.0, 250.0, 2),
    ("RADARSAT Constellation", 600.0, 125.0, 3),
    ("NISAR", 747.0, 242.0, 1),
]
print(f"{'mission':24s} period  orbits/day  ground speed  equator gap between tracks")
for name, h, sw, n in sats:
    a = R + h * 1000.0
    P = 2 * math.pi * math.sqrt(a**3 / GM)
    per_day = 86400.0 / P
    v = 2 * math.pi * R / P / 1000.0                 # ground-track speed, km/s
    gap = 40075.0 / per_day                          # spacing of successive tracks at the equator, km
    print(f"{name:24s} {P / 60:5.1f} min  {per_day:6.2f}     {v:5.2f} km/s     {gap:7.0f} km")

# Revisit: how many days to cover the equator once, and the effect of latitude
lat = 49.7   # the canal service area
print()
for name, h, sw, n in sats:
    a = R + h * 1000.0
    P = 2 * math.pi * math.sqrt(a**3 / GM); per_day = 86400.0 / P
    km_per_day = per_day * sw * n                    # swath laid down along the equator per day, km
    d_eq = 40075.0 / km_per_day
    d_lat = d_eq * math.cos(math.radians(lat))
    print(f"{name:24s} full coverage about {d_eq:4.1f} d at the equator, {d_lat:4.1f} d at {lat} N (geometry only)")

# Pushbroom detector dwell time for a 10 m pixel
v = 2 * math.pi * R / (2 * math.pi * math.sqrt((R + 786e3)**3 / GM))
print()
print(f"Sentinel-2 ground speed {v:.0f} m/s, so a 10 m line is swept in {10 / v * 1000:.2f} ms")mission period orbits/day ground speed equator gap between tracks Landsat 8/9 98.7 min 14.59 6.76 km/s 2748 km Sentinel-2 100.4 min 14.34 6.64 km/s 2795 km Sentinel-1 (IW mode) 98.5 min 14.62 6.77 km/s 2741 km RADARSAT Constellation 96.5 min 14.92 6.91 km/s 2687 km NISAR 99.6 min 14.46 6.70 km/s 2772 km Landsat 8/9 full coverage about 7.4 d at the equator, 4.8 d at 49.7 N (geometry only) Sentinel-2 full coverage about 4.8 d at the equator, 3.1 d at 49.7 N (geometry only) Sentinel-1 (IW mode) full coverage about 5.5 d at the equator, 3.5 d at 49.7 N (geometry only) RADARSAT Constellation full coverage about 7.2 d at the equator, 4.6 d at 49.7 N (geometry only) NISAR full coverage about 11.5 d at the equator, 7.4 d at 49.7 N (geometry only) Sentinel-2 ground speed 6643 m/s, so a 10 m line is swept in 1.51 ms
The code shows two things that drive mission design. First, successive ground tracks are about 2,700 km apart at the equator, much wider than any swath, so the gaps are filled over several days by an orbit chosen to shift the track slightly each day until the pattern repeats; Landsat repeats every 16 days with one satellite and offers an 8-day interval with two, and Sentinel-2 repeats every 10 days with one and 5 with two. Second, tracks converge toward the poles, so at 50° N swaths overlap and a given point is seen more often than at the equator, about two-thirds as long an interval as the geometry-only estimate for the equator suggests. Radar satellites see each point on both ascending and descending passes, day and night, which roughly doubles their frequency of coverage compared with optical sensors that use only daytime passes.
How sensors build an image
A framing camera captures a whole image at once on a two-dimensional detector array, as in the drone and aerial cameras of the photogrammetry course. Satellite multispectral sensors more often use one of two scanning designs. A whiskbroom scanner uses a rotating or oscillating mirror to sweep a small group of detectors across the track while the platform moves forward; the earlier Landsat sensors and many weather satellite imagers work this way. A pushbroom scanner uses a long linear array of thousands of detectors across the track for each band and builds the image line by line as the satellite moves forward. Pushbroom sensors have no moving mirror and each detector looks at each ground point longer, giving a better signal-to-noise ratio, but thousands of detectors must be calibrated against each other, and slight differences between them appear as faint stripes along track if they are not corrected. Landsat 8 and 9 and Sentinel-2 are pushbroom sensors.
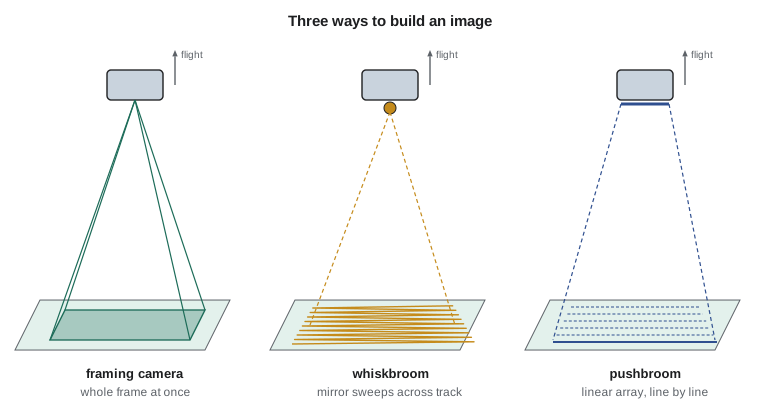
Spectral separation is achieved by filters over each detector array, by splitting the beam with dichroic mirrors, or in imaging spectrometers by dispersing light with a grating or prism onto a two-dimensional array, one direction for space and one for wavelength. Thermal detectors must be cooled to reduce their own emission and noise, and for some missions are calibrated in flight against onboard blackbodies and views of deep space. Reflective bands are calibrated with onboard lamps, diffuser panels lit by the Sun, views of the Moon and vicarious calibration over stable desert sites with ground measurements.
Free government missions
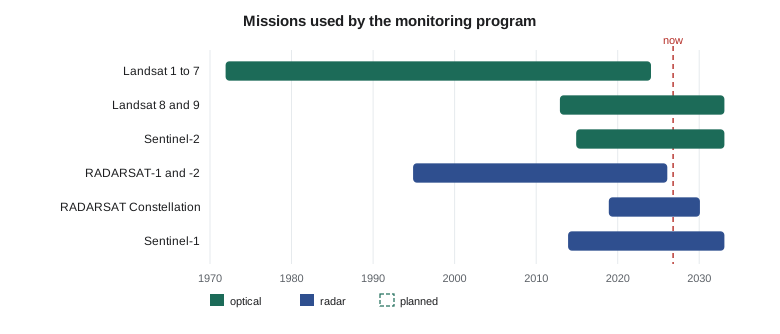
The free missions form the backbone of most agricultural and environmental programs. The Landsat program, run by NASA and the U.S. Geological Survey, has imaged the Earth since 1972 and offers the longest consistent record of land surface change. Landsat 8, launched in 2013, and Landsat 9, launched in 2021, carry the Operational Land Imager with nine reflective bands, eight at 30 m and a panchromatic band at 15 m, and the Thermal Infrared Sensor with two bands at 100 m resampled to 30 m, over a 185 km swath. The Copernicus program of the European Union operates the Sentinel missions. Sentinel-2 carries the MultiSpectral Instrument with 13 bands: four at 10 m (blue, green, red and NIR), six at 20 m (three red edge bands, a narrow NIR band and two SWIR bands) and three at 60 m for atmospheric correction, over a 290 km swath. Sentinel-1 carries a C-band synthetic aperture radar whose standard land mode covers a 250 km swath at about 5 m by 20 m resolution; Sentinel-1D was launched in November 2025 and its data opened to users in April 2026, restoring a two-satellite constellation.
Canada's own radar program is central to work in the country. The RADARSAT Constellation Mission, three identical C-band SAR satellites launched in 2019 and operated by the Canadian Space Agency, images Canada's land and ocean frequently in many modes, from wide-area coverage for ice and flood monitoring to fine-resolution modes, and with all three satellites it can revisit much of the country daily and repeat its exact geometry every four days, which suits interferometry. Its data serve federal departments first, and imagery is ordered and distributed through the Earth Observation Data Management System (EODMS) of Natural Resources Canada, where archived RADARSAT-2 and RCM products and other national data can be searched; access to some products depends on the user's eligibility under the government's data policy. The Canadian Space Agency is studying how to continue radar coverage after RCM through its Earth Observation Service Continuity initiative. Landsat and Sentinel data, which are free for everyone, are downloaded from the U.S. and European portals and from cloud archives.
Commercial and airborne sources
Commercial satellites fill gaps in detail and frequency. Very high resolution optical satellites provide panchromatic imagery at 30 to 50 cm and multispectral at about 1.2 to 2 m, tasked on request, which is enough to see individual pivots, canal structures and vehicles. Small-satellite constellations provide near-daily coverage at about 3 m in four to eight bands. Commercial radar constellations offer X-band images at sub-metre resolution that can be tasked within hours, useful after a dam or canal failure. These data carry licence terms that limit sharing, which matters when results are delivered to a public board, and their radiometric calibration is generally less stable than that of the government reference missions, so they are often cross-calibrated against Sentinel-2 or Landsat.
Airborne surveys with hyperspectral imagers, thermal cameras and lidar are commissioned for particular tasks, such as a one-time thermal survey of the canal embankments at dawn to find seepage, when the contrast between wet and dry soil is greatest. Drones are used for detailed checks of single sites and for collecting training and validation data, for example to measure canopy cover in small plots that are then compared with satellite pixels.
| Source | Resolution | Revisit | Cost to the district | Use in the program |
|---|---|---|---|---|
| Sentinel-2 | 10 to 60 m, 13 bands | About 5 days (2 to 3 at 50° N) | Free | Crop mapping, NDVI and moisture every pass |
| Landsat 8 and 9 | 30 m, thermal 100 m | 8 days with two satellites | Free | Thermal for water use, long record |
| Sentinel-1 | About 5 × 20 m, C-band | 6 to 12 days | Free | Flood mapping, soil moisture trends |
| RADARSAT Constellation | 3 to 100 m, C-band | Up to daily, 4-day repeat | Through EODMS, subject to eligibility | Bank movement by InSAR |
| Commercial optical | 0.3 to 3 m | Daily or on request | Licence fee | Detail at structures, rapid response |
| Airborne thermal survey | 0.5 to 1 m | Once | Contract | Seepage along embankments |
Worked problem
Track spacing and coverage
A satellite at 786 km altitude has a swath of 290 km. How far apart are successive tracks at the equator, and what is the minimum number of days needed for one satellite to cover the equator completely, ignoring overlap?
Show solution
- \[a = 6371 + 786 = 7157 \text{ km}, \quad P = 2\pi \sqrt{\frac{(7.157 \times 10^{6})^3}{3.986 \times 10^{14}}} = 6025 \text{ s} = 100.4 \text{ min}\]
- \[\text{orbits per day} = \frac{86400}{6025} = 14.34, \quad \text{spacing} = \frac{40075}{14.34} = 2795 \text{ km}\]
- \[\text{days} = \frac{2795}{290} = 9.6 \text{ days}\]
Answer: One satellite needs about 10 days to fill the gaps, matching the 10-day repeat of a single Sentinel-2 satellite; a second satellite 180° behind in the same orbit halves the interval.
Choosing the mix
Leah's recommendation combined free sources for routine work with occasional purchases. Sentinel-2 would supply the crop map and the two-weekly vegetation and moisture products, with Landsat 8 and 9 added for their thermal bands and to fill gaps on cloudy dates. RCM data through EODMS, with Sentinel-1 as a backup, would supply flood maps and the interferometric monitoring of the coulee banks. A commercial image would be bought only for a structure inspection or an emergency, and a dawn airborne thermal survey of the embankments was proposed for the first August. Every source would be documented with its processing level, version and acquisition time, so that the products could be reproduced.
Common mistakes
MistakeAssuming the nominal repeat cycle is the interval between useful images.
InsteadCloud removes many optical acquisitions; plan on the probability of clear views, not the revisit alone.
MistakeComparing a mid-morning Landsat thermal image with an afternoon image from another sensor without adjustment.
InsteadSurface temperature changes through the day; compare images at similar overpass times or model the change.
MistakeIgnoring licence terms of commercial data.
InsteadCheck whether products derived from licensed imagery can be published or shared with the client's partners.
MistakeTreating all radar satellites as interchangeable.
InsteadWavelength, polarization, incidence angle and repeat geometry differ and determine what can be measured.
Summary and key terms
- Satellites, aircraft, drones and fixed installations trade coverage, detail, cost and flexibility.
- Sun-synchronous orbits give a constant local overpass time; geostationary orbits give images every few minutes at coarse resolution.
- Track spacing, swath width and the number of satellites determine the repeat interval, which shortens toward the poles.
- Framing, whiskbroom and pushbroom designs build images differently; pushbroom sensors dominate modern land imaging.
- Landsat and Sentinel-2 provide free calibrated optical data; Sentinel-1 and national radar missions provide free or government radar.
- Commercial optical and radar constellations add detail and frequency under licence terms.
- A monitoring program combines sources according to the needed resolution, frequency, wavelengths and budget.
- Sun-synchronous orbit
- A near-polar orbit whose plane precesses once a year, so the satellite passes each latitude at the same local solar time.
- Geostationary orbit
- An equatorial orbit about 35,786 km high whose period equals one sidereal day.
- Pushbroom scanner
- A sensor with a linear detector array across track that builds an image line by line.
- Whiskbroom scanner
- A sensor that sweeps a small group of detectors across track with a moving mirror.
- Swath
- The width of ground imaged in one pass.
- Repeat cycle
- The interval after which a satellite returns to exactly the same ground track.
Practice problems
Work each problem on paper first, then reveal the answer to check.
What is the orbital period at 700 km altitude?
Show answer
a = 7071 km; P = 2π √(a³/GM) = 5926 s = 98.8 min.
A pushbroom sensor has 6,000 detectors per band at 30 m. What is its swath?
Show answer
6,000 × 30 m = 180 km.
Why do most land imaging satellites cross the equator in mid-morning?
Show answer
To balance sun elevation and haze against afternoon cloud and keep illumination consistent between dates.
A satellite repeats every 12 days and sees each site on ascending and descending passes. How often is a site imaged?
Show answer
About twice every 12 days, with different geometry on the two passes.
Which of Sentinel-2's bands would you use for a 10 m crop boundary map?
Show answer
Blue, green, red and NIR, the four 10 m bands.
Lesson quiz · 5 questions
Score 60% or more to complete this lesson.
Create a free account to save your progress, take quizzes and earn a certificate.