
GEOM-200 · Lesson 12 of 12 · 21 min
Geomatics in engineering projects
The earlier lessons looked at the tools and ideas of geomatics one at a time. On a real engineering project they all work together, from the first look at a map in the planning stage to the monitoring of a finished structure decades later. This final lesson follows a project through its life and shows where geomatics fits at each stage: planning and route selection, control networks, design surveys, construction layout and machine guidance, as-built records, deformation monitoring and asset management. It also covers the business side of the work, including specifications, quality management, coordinate system decisions and data handover, which often decide whether a project's geomatics succeeds. GEOM-420 Engineering and Construction Surveying and GEOM-450 Land Development and Subdivision Design develop this material in depth.
Geomatics across the project life cycle
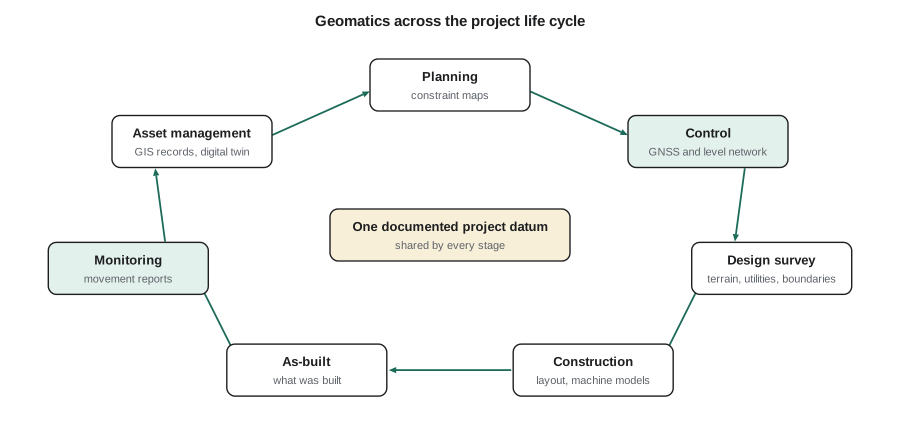
| Stage | Geomatics work | Main products |
|---|---|---|
| Planning | Existing mapping, imagery, lidar, GIS analysis of constraints | Route or site options, constraint maps |
| Control | GNSS and levelling networks tied to the national datum | Control points with coordinates and uncertainties |
| Design survey | Topography, utilities, boundaries, hydrography | Base plan, terrain model, legal survey |
| Construction | Layout, machine guidance, quantity measurement | Stakes, guidance models, pay quantities |
| As-built | Survey of what was actually built | As-built drawings, models, GIS updates |
| Operation | Deformation monitoring, inspection, asset inventory | Movement reports, condition data, digital twin |
Planning with existing data
Before anyone visits the site, a great deal can be learned from existing geospatial data. Public lidar shows the terrain and drainage; orthophotos and satellite imagery show land use and access; GIS layers show parcels, utilities, wetlands, floodplains, protected areas and soils; and land records show who owns what and what rights already exist. A GIS overlay of these constraints narrows a pipeline route or a road alignment to a few feasible corridors, which are then compared on length, cost, environmental impact and risk. The geomatics engineer's contribution is to know what each dataset can and cannot support, so that a decision is not built on a layer that is several metres out or many years old.
For the pipeline right-of-way east of Lethbridge, Marcus built a constraint model from provincial lidar, the Alberta wetland inventory, land titles and existing energy dispositions, and coulee slope maps. It reduced 40 km of possible corridor to three options, and the client chose the one that crossed the fewest coulees and wetlands, even though it was 1.8 km longer.
Control: the framework for everything
Every project needs a set of control points with known coordinates, from which all surveys and layout are measured. The control network is designed for the accuracy and life of the project: closely spaced, well-monumented points out of the way of construction, measured by GNSS static sessions and precise levelling, adjusted by least squares and tied to the national reference frame. A good control network means that the design surveyors, the contractor's layout crews, the machine guidance systems and the monitoring team years later all work in the same coordinates, and that any two points can be checked against each other.
Choosing the project coordinate system is one of the most important early decisions, and one of the most often neglected. The choices are a standard map projection such as UTM or state plane, a low-distortion projection designed for the site, or a local ground system scaled from grid. Lesson 3 and CIV-250 lesson 9 explained the trade-offs. The decision must be documented in a project datum statement giving the frame and epoch, projection parameters, vertical datum and geoid model, units and any scale factor, and that statement must travel with every dataset handed to designers and contractors. Many expensive construction errors come from a contractor using grid coordinates where the design used ground, or a different geoid model, or the wrong foot.
Worked problem
Is the scale factor worth worrying about?
The Coulee Ridge Drive extension is 1.2 km long. The combined scale factor (grid to ground) at the site in Alberta 3TM is 0.99968. If designers lay out the road in grid coordinates but the contractor measures ground distances with a total station and assumes they are grid, how large is the discrepancy over the full length?
Show solution
- \[\text{grid distance} = 1200.000\ \text{m}\]
- \[\text{ground distance} = \frac{1200.000}{0.99968} = 1200.384\ \text{m}\]
- \[\text{discrepancy} = 0.384\ \text{m} \to 320\ \text{ppm}\]
Answer: A 38 cm discrepancy is far larger than the few centimetres allowed for road layout. The project datum statement specifies ground coordinates scaled about control point CR-1, so the total station and the design agree directly, and the scale factor is recorded so that GIS and GNSS data can be converted.
Design surveys
The design survey captures what is there now: the ground surface, buildings, roads, trees, drainage, utilities and boundaries. Its accuracy and level of detail are set by the design: a building site needs centimetre topography and every utility; a corridor study may accept lidar terrain with spot checks. Utilities deserve special care. Records of buried pipes and cables are often incomplete, and hitting an unrecorded gas line is dangerous. Subsurface utility engineering combines records research, surface geophysics such as ground-penetrating radar and electromagnetic locating, and test holes to expose utilities, and assigns each utility a quality level so designers know how much to trust its position. Legal surveys establish the boundaries and rights the project must respect, and may be needed to acquire new land or easements.
Construction layout and machine guidance
During construction, the design moves from the computer to the ground. Traditional layout places stakes with offsets and cut or fill marks for the equipment operators, as CIV-250 lesson 12 describes. Increasingly, the design model is loaded directly into machine guidance systems on excavators, dozers, graders and pavers. GNSS or robotic total stations track the machine's blade or bucket, and the system shows the operator, or controls automatically, how much to cut or fill. Machine guidance can cut staking by most of its volume and improve accuracy, but it moves the geomatics responsibility upstream: the surface model, the coordinate system and the site calibration must be right, because the machines will build exactly what they are given.
Geomatics also measures quantities for payment. Stockpile and excavation volumes come from drone photogrammetry or lidar surfaces compared with the original ground model. Because these quantities are paid for, the methods, control and accuracy must be agreed in the contract, and both owner and contractor often survey the same surfaces independently.
As-built records and digital twins
What is built never matches the design exactly. As-built surveys record what was actually constructed: pipe inverts, structure locations, finished grades, building positions and utilities before they are buried. As-built data update the GIS of the owner, whether a municipality, utility or irrigation district, and are the foundation for future maintenance and for anyone who digs nearby later. Building information modelling (BIM) and digital twins extend this to a three-dimensional model of the asset linked to its attributes and, in some cases, to live sensor data. Laser scanning is now the standard way to capture as-built conditions of complex structures for these models.
Deformation monitoring
Many structures and slopes must be watched for movement: dams, bridges, retaining walls, tunnels, tall buildings, mine walls, landslides and buildings near deep excavations. Deformation monitoring measures target points repeatedly and compares each epoch with a baseline to detect movement. Methods include precise levelling for settlement, robotic total stations measuring prisms automatically every few minutes, GNSS receivers on structures, laser scanning and InSAR for wide areas, and geotechnical sensors such as inclinometers and tiltmeters. The geomatics engineer designs the network so that reference points are well outside the zone of movement, chooses measurement frequency and precision to detect the movement that matters, and sets alert thresholds with the geotechnical and structural engineers.
A key question in monitoring is whether an apparent movement is real or just measurement noise. If each epoch's coordinates have a standard deviation \(\sigma\), the difference between two epochs has a standard deviation of \(\sigma\sqrt{2}\), and a movement is usually treated as significant at about 95 per cent confidence if it exceeds about 1.96 times that value in one dimension, or about 2.45 times it for a horizontal displacement in two dimensions.
# Deformation monitoring: which prisms on a retaining wall have moved significantly?
import math

sigma = 0.0015                      # standard deviation of each coordinate, each epoch (m)
k2d, k1d = 2.45, 1.96              # 95% factors for 2D and 1D tests
baseline = {"W1": (1203.4512, 4876.2210, 902.1135), "W2": (1213.4498, 4876.2244, 902.1109),
            "W3": (1223.4520, 4876.2187, 902.1152), "W4": (1233.4505, 4876.2231, 902.1120),
            "REF": (1180.0000, 4950.0000, 905.0000)}
epoch = {"W1": (1203.4519, 4876.2201, 902.1131), "W2": (1213.4544, 4876.2172, 902.1061),
         "W3": (1223.4582, 4876.2098, 902.1083), "W4": (1233.4521, 4876.2213, 902.1104),
         "REF": (1180.0004, 4949.9997, 905.0002)}

s_diff = sigma * math.sqrt(2)
print(f"Threshold: horizontal {k2d * s_diff * 1000:.1f} mm, vertical {k1d * s_diff * 1000:.1f} mm")
print("Point   dE(mm)  dN(mm)  dH(mm)  horiz(mm)  result")
for p in baseline:
    dE, dN, dH = (epoch[p][i] - baseline[p][i] for i in range(3))
    horiz = math.hypot(dE, dN)
    flags = []
    if horiz > k2d * s_diff:
        flags.append("horizontal movement")
    if abs(dH) > k1d * s_diff:
        flags.append("settlement" if dH < 0 else "heave")
    print(f"{p:5s} {dE * 1000:7.1f} {dN * 1000:7.1f} {dH * 1000:7.1f} {horiz * 1000:9.1f}   "
f"{', '.join(flags) if flags else 'no significant change'}")Threshold: horizontal 5.2 mm, vertical 4.2 mm Point dE(mm) dN(mm) dH(mm) horiz(mm) result W1 0.7 -0.9 -0.4 1.1 no significant change W2 4.6 -7.2 -4.8 8.5 horizontal movement, settlement W3 6.2 -8.9 -6.9 10.8 horizontal movement, settlement W4 1.6 -1.8 -1.6 2.4 no significant change REF 0.4 -0.3 0.2 0.5 no significant change
With 1.5 mm precision per coordinate, a point must move more than about 5 mm horizontally or 4 mm vertically before the change can be called real. The reference point and W1 show only noise. W2 and W3, in the middle of the wall, have moved 8 to 11 mm toward the excavation (to the southeast in this layout) and settled 5 to 7 mm, while W4, near the end of the wall, shows only noise. That pattern, larger movement at mid-span, is what the geotechnical engineer would expect from a wall beginning to bulge, and the report goes to the design team the same day with a recommendation to increase the monitoring frequency.
Asset management
Once a project is built, its owner must maintain it for decades. Asset management systems, usually built on GIS, record every asset's location, attributes, condition and maintenance history, and help owners decide what to repair or replace and when. Geomatics supplies the location framework, the periodic inventories from mobile mapping or drone surveys, and the change detection that shows which assets are deteriorating. For an irrigation district, this means canal cross-sections that show sedimentation and bank erosion; for a municipality, pavement and sidewalk condition; for a pipeline operator, depth of cover surveys and ground movement monitoring in coulee crossings.
Specifications, quality and handover
Geomatics work on engineering projects is usually done under a contract with a specification that states what must be delivered, to what accuracy, in what coordinate system and formats, and how quality will be demonstrated. A good specification states accuracy as a measurable value, such as an RMSE against independent check points or a misclosure limit, rather than words like high accuracy, and it names the standard that applies. A quality management plan describes the checks the geomatics team will carry out: calibration records, redundant measurements, independent check points, peer review of computations and a final review before delivery.
Data handover is where many projects lose information. Deliverables should include the project datum statement, control point list with uncertainties, metadata for each dataset, and files in open, documented formats. Coulee Geomatics delivers every project with a short survey report that explains what was done, the methods and checks, the results of accuracy tests and any limitations, signed by the responsible professional. That report is what lets the next engineer, perhaps 20 years later, decide whether the data can be trusted.
Looking ahead
Geomatics is changing fast. Real-time positioning and machine automation are spreading from construction into agriculture, mining and transport; reality capture by drones, scanners and phones is becoming routine; machine learning is extracting features from imagery and point clouds; and reference frames are becoming dynamic, with the new North American frames recognizing that coordinates change with time. The engineer's core contributions remain the same: understanding measurement and its uncertainty, choosing and documenting the right reference system, checking results independently and taking professional responsibility for the data that others will build on.
Common mistakes
MistakeLeaving the project coordinate system undocumented.
InsteadIssue a project datum statement and include it with every dataset.
MistakeRelying on utility records alone.
InsteadUse subsurface utility engineering with quality levels for each utility.
MistakeTreating every apparent movement as real.
InsteadTest differences between epochs against thresholds based on measurement precision.
MistakeSpecifying accuracy in words.
InsteadSpecify a measurable value and the standard used to test it.
Summary and key terms
- Geomatics supports every stage of a project, from planning to asset management.
- A control network and documented project datum keep everyone in the same coordinates.
- Machine guidance moves geomatics responsibility upstream to the models and calibration.
- As-built surveys and digital twins record what was actually built.
- Monitoring distinguishes real movement from noise using statistical thresholds.
- Measurable specifications, quality plans and clear handover protect the value of the data.
- Project datum statement
- A document defining a project’s reference frame, projection, vertical datum, units and scale.
- Machine guidance
- Systems that position construction machines against a design model.
- As-built survey
- A survey recording what was actually constructed.
- Digital twin
- A model of an asset linked to its data and, in some cases, to live sensors.
- Deformation monitoring
- Repeated measurement of points to detect movement of a structure or slope.
- Subsurface utility engineering
- A process for locating buried utilities and rating the reliability of their positions.
- Asset management
- Managing infrastructure assets over their life using location, condition and cost data.
Practice problems
Work each problem on paper first, then reveal the answer to check.
A combined scale factor is 0.99960. What is the ground distance for a grid distance of 800.000 m?
Show answer
\(800.000/0.99960 = 800.320\) m.
Each epoch has σ = 2 mm per coordinate. What is the 2D 95 per cent threshold for movement?
Show answer
\(2.45 \times 2\sqrt{2} = 6.9\) mm.
Why should monitoring reference points be outside the zone of movement?
Show answer
So that movement of the structure is not hidden by movement of the reference.
Name three items a project datum statement should contain.
Show answer
Reference frame and epoch, projection parameters, vertical datum and geoid model, units, scale factor.
What is the main geomatics risk in machine guidance?
Show answer
A wrong surface model, coordinate system or site calibration, which the machines will build exactly.
Lesson quiz · 5 questions
Score 60% or more to complete this lesson.
Create a free account to save your progress, take quizzes and earn a certificate.