
ELE-280 · Lesson 2 of 12 · 23 min
Measurement fundamentals, units and standards
A measurement is a comparison. When a meter says 23.96 V, it is reporting that the voltage between its probes is 23.96 times a unit called the volt, and the meter can only make that claim because somebody, somewhere, compared it with a better reference, which was compared with a better one still, all the way back to a definition of the volt. This lesson covers that chain: the SI units electrical engineers use, how they are defined and kept, what accuracy, precision and resolution mean, how to read an instrument specification, and how to report a number so that its reader knows how much to trust it.
Leo's first measurement at Cedarline seems trivial. Amara hands him a prototype controller board and asks him to measure its 24 V supply rail and its 5 V logic rail and write down the results. He reads 24.07 V and 4.982 V on the bench meter and writes exactly that. Amara asks three questions he cannot answer: how good is the meter, how do you know, and how many of those digits mean anything? By the end of this lesson he can.
SI units for electrical work
The International System of Units has seven base units. The ones that matter most at the bench are the second, the metre, the kilogram, the ampere and the kelvin. Every electrical unit is derived from them: the volt is a watt per ampere, the ohm a volt per ampere, the farad a coulomb per volt, the henry a weber per ampere and the hertz an inverse second. Prefixes scale units by powers of ten, and you will use most of them in a single afternoon: picofarads in a probe, nanoseconds in a rise time, microamperes in a sleep current, milliohms in a contact, kilohms and megohms in resistors and meter inputs, and gigahertz in an oscilloscope's sample rate.
| Quantity | Unit | Symbol | In base or other units |
|---|---|---|---|
| Electric current | ampere | A | Base unit |
| Charge | coulomb | C | A·s |
| Potential difference | volt | V | W/A |
| Resistance | ohm | Ω | V/A |
| Conductance | siemens | S | A/V |
| Capacitance | farad | F | C/V |
| Inductance | henry | H | Wb/A |
| Frequency | hertz | Hz | 1/s |
| Power | watt | W | J/s |
Since a revision that took effect in May 2019, every SI base unit is defined by fixing the numerical value of a fundamental constant. The ampere is defined by fixing the elementary charge, e, at exactly 1.602 176 634 × 10⁻¹⁹ coulomb, so one ampere is a flow of a definite number of electrons per second. The kilogram is fixed through the Planck constant, h. Those two constants matter for electrical metrology because two quantum effects depend only on them. The Josephson effect, in superconducting junctions driven by microwaves, produces voltages set by h/2e and a frequency, which can be measured extremely precisely. The quantum Hall effect produces resistances set by h/e². National laboratories use these effects to realize the volt and the ohm with uncertainties of parts per billion.
Traceability and calibration
In Canada, the National Research Council (NRC) maintains the national measurement standards. It realizes the volt and the ohm and calibrates the reference instruments of accredited calibration laboratories, which in turn calibrate working instruments such as Cedarline's bench meters. The Standards Council of Canada accredits calibration laboratories against ISO/IEC 17025, the international standard for the competence of testing and calibration labs. Each step in the chain is documented with a certificate that states the measured values and their uncertainties. That unbroken, documented chain of comparisons is called metrological traceability.
A calibration certificate does not make a meter perfect. It records how far the meter's readings were from the reference at the time of calibration, whether those errors were inside the manufacturer's specification, and the uncertainty of the calibration itself. Instruments drift with time and temperature, so calibrations expire, typically after a year for a bench meter. A sticker on Cedarline's meter shows its calibration date, its due date and the lab that did it. Amara's first answer to Leo is that the meter is good because it was compared with a traceable reference eight months ago and was within its one-year specification.
Accuracy, precision and resolution
Three words that people use loosely have precise meanings in measurement. Accuracy is how close a measurement is to the true value of the quantity. Precision describes how closely repeated measurements agree with each other, whether or not they are near the true value. Resolution is the smallest change the instrument can display or detect. A meter can have fine resolution and poor accuracy: a cheap six-digit display that reads 4.98217 V when the true voltage is 5.01000 V. It can be precise and inaccurate: ten readings that all agree to within a millivolt but are all 30 mV high because of an offset. And it can be accurate on average but imprecise, with readings scattered around the right value.
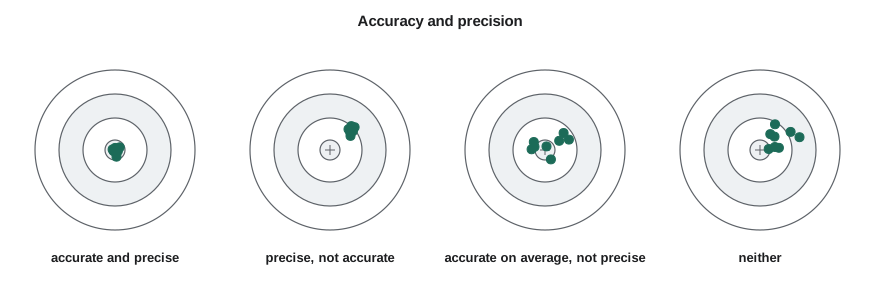
Behind those words are two kinds of error. A systematic error pushes every measurement the same way: a zero offset, a gain error, the loading of the circuit by the meter, or a lead resistance that is always added. Repeating the measurement does not reveal a systematic error, because every repetition shares it. A random error varies unpredictably from one measurement to the next: electrical noise, the last digit flickering, a probe pressed slightly differently each time. Averaging many readings reduces the effect of random error but does nothing to systematic error. Lesson 3 turns these ideas into numbers.
Reading an instrument specification
A digital multimeter's accuracy is usually specified as ±(percentage of reading + number of counts), for a given range, temperature band and period after calibration. A count is one unit in the last displayed digit. A meter with a 6,000-count display shows at most 5,999 on any range, so on its 6 V range it resolves 1 mV, and on its 60 V range it resolves 10 mV. Some manufacturers quote the second term as a percentage of range instead of counts, which comes to the same thing. The specification is a guaranteed limit for any instrument of that model within its calibration period, not the error of your particular meter, which is usually smaller.
Worked problem
Accuracy of the 24 V reading
Leo's meter has a 60,000-count display. On its 60 V DC range, its one-year accuracy is ±(0.05 % of reading + 5 counts). He reads 24.070 V. Find the accuracy limit and the interval in which the true voltage lies, assuming the meter is within specification.
Show solution
- On the 60 V range, a 60,000-count display resolves 60 V / 60,000 = 1 mV, so one count is 0.001 V.
- \[\Delta V = 0.0005 \times 24.070\ \text{V} + 5 \times 0.001\ \text{V} = 0.0120\ \text{V} + 0.0050\ \text{V} = 0.0170\ \text{V}\]
- The true voltage lies within 24.070 ± 0.017 V, that is, between 24.053 V and 24.087 V.
Answer: About ±17 mV, so the true voltage is between 24.053 V and 24.087 V. The last digit of the reading, 1 mV, is finer than the accuracy, so it carries little information.
Two consequences follow. First, the counts term matters most for small readings: measuring 0.100 V on the 60 V range gives an error limit of 0.05 mV plus 5 mV, about 5 % of the reading. Always choose the lowest range that holds the value, which is what autoranging meters do for you. Second, specifications have conditions: they usually hold between 18 and 28 °C, for a stated time after calibration, and only for DC or for AC within a stated frequency band. Outside those conditions, the manufacturer adds a temperature coefficient or promises nothing.
# Accuracy limit for a DMM reading: +/-(percent of reading + counts)
def dmm_limit(reading, range_full, counts_display, pct, counts):
    lsd = range_full / counts_display          # value of one count on this range
    return pct / 100 * abs(reading) + counts * lsd, lsd

cases = [("24 V rail", 24.070, 60.0),
         ("5 V rail", 4.9820, 6.0),
         ("0.1 V on 60 V range", 0.100, 60.0),
         ("0.1 V on 0.6 V range", 0.1000, 0.6)]
for name, r, rng in cases:
    lim, lsd = dmm_limit(r, rng, 60000, 0.05, 5)
    print(f"{name:22s} reading {r:8.4f} V  limit +/-{lim*1000:7.3f} mV "
f"({100*lim/r:5.3f} % of reading), one count = {lsd*1000:.2f} mV")24 V rail reading 24.0700 V limit +/- 17.035 mV (0.071 % of reading), one count = 1.00 mV 5 V rail reading 4.9820 V limit +/- 2.991 mV (0.060 % of reading), one count = 0.10 mV 0.1 V on 60 V range reading 0.1000 V limit +/- 5.050 mV (5.050 % of reading), one count = 1.00 mV 0.1 V on 0.6 V range reading 0.1000 V limit +/- 0.100 mV (0.100 % of reading), one count = 0.01 mV
The output shows why Leo's 5 V reading is better than he thought and his small readings worse. On the 6 V range, the 5 V rail is known to about ±3 mV, under 0.1 %. A 0.1 V reading on the 60 V range is uncertain by about 5 %, but on the 0.6 V range it is uncertain by about 0.1 %. The meter is the same; only the range changed.
Significant figures and reporting results
A measured value is not complete without its uncertainty and its unit. The usual style is to round the uncertainty to one or two significant figures and then round the value to the same decimal place: 24.070 ± 0.017 V, not 24.0700 ± 0.0170 V and not 24.07 ± 0.017 V. When no uncertainty is stated, the number of significant figures implies one. Writing 4.982 V claims millivolt confidence; writing 4.98 V claims ten-millivolt confidence. Calculated results should not carry more digits than the inputs justify. If you divide 24.07 V by 1.2 kΩ, the result 20.058333 mA from your calculator should be written as about 20.1 mA if the resistor is known only to two figures, or with a stated uncertainty if you have one.
Engineers also express ratios in decibels. A power ratio in decibels is 10 log₁₀(P₂/P₁), and since power is proportional to voltage squared in the same resistance, a voltage ratio in decibels is 20 log₁₀(V₂/V₁). A factor of two in voltage is about 6 dB, a factor of ten is 20 dB. Absolute levels use a reference: dBm is decibels relative to 1 mW, and dBV relative to 1 V RMS. Oscilloscope bandwidths, filter responses and noise levels are all quoted in decibels, and you will meet them again in lessons 5, 7 and 11.
Worked problem
Reporting a calculated current
Leo measures 4.982 V across a 100.0 Ω current-sense resistor with ±0.1 % tolerance and computes the current. His meter's limit on that reading is ±3.0 mV. Report the current with a reasonable uncertainty.
Show solution
- The current is I = V/R = 4.982 V / 100.0 Ω = 0.04982 A = 49.82 mA.
- The relative limit of the voltage is 3.0 mV / 4.982 V ≈ 0.060 %. The resistor contributes 0.1 %.
- For a quotient, relative uncertainties combine. A cautious worst case adds them; lesson 3 shows the usual root-sum-square method.
- \[\frac{\Delta I}{I} \approx 0.060\,\% + 0.10\,\% = 0.16\,\% \quad\Rightarrow\quad \Delta I \approx 0.16\,\% \times 49.82\ \text{mA} \approx 0.08\ \text{mA}\]
Answer: I = 49.82 ± 0.08 mA by the worst-case sum, which is about ±0.06 mA by root-sum-square. Writing 49.8 mA would also be honest; writing 49.820000 mA would not.
Common mistakes
MistakeTreating the number of displayed digits as the accuracy.
InsteadResolution is not accuracy; check the specification, which is often many counts larger than one digit.
MistakeMeasuring a small voltage on a high range.
InsteadThe counts term dominates; use the lowest range that holds the reading.
MistakeAssuming averaging removes all error.
InsteadAveraging reduces random error only; offsets, gain errors and loading remain.
MistakeUsing a meter past its calibration due date without saying so.
InsteadRecord the calibration status; an expired calibration means the specification is no longer guaranteed.
MistakeReporting a value with more digits than its uncertainty supports.
InsteadRound the uncertainty to one or two significant figures and the value to match.
Summary and key terms
- All SI base units are now defined by fixed constants; the volt and ohm are realized with the Josephson and quantum Hall effects.
- Traceability is an unbroken, documented chain of calibrations back to national standards, with uncertainty growing at each step.
- Accuracy is closeness to the true value; precision is agreement between repeated readings; resolution is the smallest displayed change.
- Systematic errors shift every reading; random errors scatter them, and only random errors average away.
- DMM accuracy is ±(% of reading + counts) under stated conditions; use the lowest range to keep the counts term small.
- Report a value with its uncertainty and unit, rounded consistently; decibels express ratios as 10 log for power and 20 log for voltage.
- Traceability
- The property of a measurement that can be related to a reference through a documented, unbroken chain of calibrations, each with stated uncertainty.
- Calibration
- Comparison of an instrument with a reference of known value and uncertainty, with the results recorded.
- Accuracy
- Closeness of agreement between a measured value and the true value.
- Precision
- Closeness of agreement between repeated measurements under the same conditions.
- Resolution
- The smallest change in a quantity that an instrument can display or detect.
- Count
- One unit in the least significant displayed digit of a digital instrument.
- Systematic error
- An error that stays the same or changes predictably across repeated measurements.
- Random error
- An error that varies unpredictably between repeated measurements.
Practice problems
Work each problem on paper first, then reveal the answer to check.
A 6,000-count meter is on its 600 mV range. What is one count?
Show answer
0.1 mV.
With ±(0.1 % + 3 counts), what is the limit on a 2.500 V reading on a 6,000-count meter's 6 V range?
Show answer
2.5 mV + 3 mV = 5.5 mV.
Express a voltage gain of 0.5 in decibels.
Show answer
20 log₁₀(0.5) ≈ −6.0 dB.
Ten readings of a voltage agree within 0.2 mV but are all 15 mV above a calibrated reference. Describe the meter.
Show answer
Precise but not accurate; it has a systematic offset of about 15 mV.
Round 12.3456 ± 0.0237 V for a report.
Show answer
12.346 ± 0.024 V, or 12.35 ± 0.02 V.
Which quantum effect realizes the ohm?
Show answer
The quantum Hall effect.
Lesson quiz · 5 questions
Score 60% or more to complete this lesson.
Create a free account to save your progress, take quizzes and earn a certificate.